Prosecutions for February 2015
Referring Agency: Immigration and Customs in Homeland Security
The latest available data from the Justice Department show that during February 2015 the government reported 6717 new prosecutions for these matters. Those cases were referred by the Immigration and Customs in Homeland Security. According to the case-by-case information analyzed by the Transactional Records Access Clearinghouse (TRAC), this number is up 26.2 percent over the previous month.
The comparisons of the number of defendants charged are based on case-by-case information obtained by TRAC under the Freedom of Information Act from the Executive Office for United States Attorneys (see Table 1).
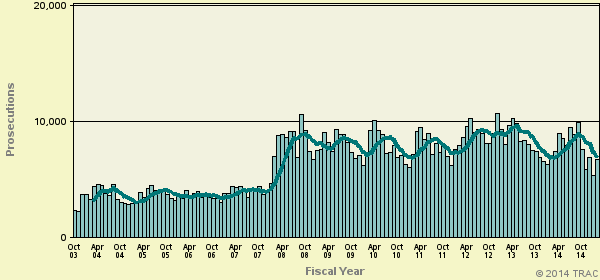
When monthly 2015 prosecutions of this type are compared with those of the same period in the previous year, the number of filings was only slightly up (1.6%). Prosecutions over the past year are still much lower than they were five years ago. Overall, the data show that prosecutions of this type are down 0.7 percent from levels reported in 2010.
The leveling out from the levels five years ago in prosecutions for these matters is shown more clearly in Figure 1. The vertical bars in Figure 1 represent the number of prosecutions of this type recorded on a month-to-month basis. Where a prosecution was initially filed in U.S. Magistrate Court and then transferred to the U.S. District Court, the magistrate filing date was used since this provides an earlier indicator of actual trends. The superimposed line on the bars plots the six-month moving average so that natural fluctuations are smoothed out. The one and five-year rates of change in Table 1 and in the sections that follow are all based upon this six-month moving average.
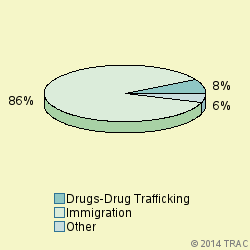
Cases were classified by prosecutors into more specific types.
The largest number of prosecutions of these matters in February 2015 was for "Immigration", accounting for 86.2 percent of prosecutions. Prosecutions were also filed for "Drugs-Drug Trafficking" (8.3%). See Figure 2.
Prosecutions in U.S. Magistrate Courts
Top Ranked Lead Charges
In February 2015, 5682 defendants in cases for these matters were filed in U.S. Magistrate Courts. These courts handle less serious misdemeanor cases, including what are called "petty offenses." In addition, complaints are sometimes filed in the magistrate courts before an indictment or information is entered. In these cases, the matter starts in the magistrate courts and later moves to the district court where subsequent proceedings take place.
In the magistrate courts in February the most frequently cited lead charge was Title 8 U.S.C Section 1325 involving "Entry of alien at improper time or place; etc.". This was the lead charge for 48.1 percent of all magistrate filings in February.
Other frequently prosecuted lead charges include: "08 USC 1326 - Reentry of deported alien" (37.8%).
Prosecutions in U.S. District Courts
In February 2015, 1035 defendants in new cases for these matters were charged in the U.S. District Courts. In addition during February there were an additional 1053 defendants whose cases moved from the magistrate courts to the U.S. district courts after an indictment or information was filed. The sections which follow cover both sets of cases and therefore cover all matters filed in district court during February.
Top Ranked Lead Charges
Table 2 shows the top lead charges recorded in the prosecutions of matters filed in U.S. District Court during February 2015 referred by the Immigration and Customs in Homeland Security.
Lead Charge Count Rank 1yr ago 5yrs ago 08 USC 1326 - Reentry of deported alien 1,256 1 1 1 More 08 USC 1324 - Bringing in and harboring certain aliens 184 2 2 2 More 21 USC 841 - Drug Abuse Prevention & Control-Prohibited acts A 101 3 3 3 More 21 USC 846 - Attempt and conspiracy 100 4 4 7 More 21 USC 952 - Importation of controlled substances 97 5 5 5 More 18 USC 2252 - Material involving sexual exploitation of minors 36 6 9 8 More 18 USC 922 - Firearms; Unlawful acts 30 7 7 10 More 18 USC 1546 - Fraud and misuse of visas, permits, and other documents 23 8 6 4 More 08 USC 1325 - Entry of alien at improper time or place; etc. 21 9 8 6 More 18 USC 1544 - Misuse of passport 17 10 10 14 More Table 2. Top Charges Filed
"Reentry of deported alien" (Title 8 U.S.C Section 1326) was the most frequent recorded lead charge. "Reentry of deported alien" (Title 8 U.S.C Section 1326) was ranked 1 a year ago, while it was ranked 1 five years ago.
Ranked 2nd in frequency was the lead charge "Bringing in and harboring certain aliens" under Title 8 U.S.C Section 1324. "Bringing in and harboring certain aliens" under Title 8 U.S.C Section 1324 was ranked 2 a year ago, while it was ranked 2 five years ago.
Ranked 3rd was "Drug Abuse Prevention & Control-Prohibited acts A" under Title 21 U.S.C Section 841. "Drug Abuse Prevention & Control-Prohibited acts A" under Title 21 U.S.C Section 841 was ranked 3 a year ago, while it was ranked 3 five years ago.
Among these top ten lead charges, the one showing the greatest increase in prosecutions — up 33.5 percent — compared to one year ago was Title 18 U.S.C Section 1544 that involves " Misuse of passport ". This was the same statute that had the largest increase — 313.7 % — when compared with five years ago.
Again among the top ten lead charges, the one showing the sharpest decline in prosecutions compared to one year ago — down 36.9 percent — was " Firearms; Unlawful acts " (Title 18 U.S.C Section 922 ). Compared to five years ago, the most significant decline in prosecutions — 67.7 percent — was for filings where the lead charge was " Entry of alien at improper time or place; etc. " (Title 8 U.S.C Section 1325 ).
Top Ranked Judicial Districts
In February 2015 the Justice Department said the government brought 798.3 prosecutions for every ten million people in the United States.
Understandably, there is great variation in the per capita number of prosecutions that are filed in each of the nation's ninety-four federal judicial districts.
The districts registering the largest number of prosecutions per capita for these matters last month are shown in Table 3. Districts must have at least 5 prosecutions to receive a ranking.
Judicial District Percapita Count Rank 1yr ago 5yrs ago N Mexico 14,514 252 1 5 5 More Cal, S 9,055 253 2 4 3 More Texas, W 5,405 297 3 2 2 More Arizona 5,239 286 4 3 4 More Texas, S 5,202 386 5 1 1 More N Dakota 3,422 20 6 20 26 More Nebraska 1,164 18 7 19 34 More Utah 883 21 8 13 14 More Okla, N 700 6 9 36 89 More Penn, W 695 22 10 62 42 More Table 3. Top 10 Districts (per ten million people)
The District of New Mexico — with 14514 prosecutions as compared with 798.3 prosecutions per ten million population in the United States — was the most active during February 2015. The District of New Mexico was ranked 5 a year ago, while it was ranked 5 for most frequent use five years ago.
The Southern District of California (San Diego) ranked 2nd. The Southern District of California (San Diego) was ranked 4 a year ago, while it was ranked 3 for most frequent use five years ago.
Western District of Texas (San Antonio) is now ranking 3rd. The Western District of Texas (San Antonio) was ranked 2 a year ago, while it was ranked 2 for most frequent use five years ago.
Recent entrants to the top 10 list were Utah , now ranked 8th , and Nebraska at 7th In the same order, these districts ranked 13th and 19th one year ago and 14th and 34th five years ago.
The federal judicial district which showed the greatest growth in the rate of prosecutions compared to one year ago — 131.6 percent — was Western District of Pennsylvania (Pittsburgh). Compared to five years ago, the district with the largest growth — 616.7 percent — was Northern District of Oklahoma (Tulsa).
In the last year, the judicial District Court recording the largest drop in the rate of prosecutions — 13.3 percent — was Nebraska . But over the past five years, Western District of Texas (San Antonio) showed the largest drop — 27 percent.
Top Ranked District Judges
At any one time, there are about 680 federal District Court judges working in the United States. The judges recorded with the largest number of new crime cases of this type during February 2015 are shown in Table 4.
Judge Count Rank 1yr ago 5yrs ago Brack, Robert C. N Mexico 118 1 4 1 More Moses, Alia Texas, W 97 2 2 - More Gonzales, Kenneth John N Mexico 87 3 1 - More Hanen, Andrew S. Texas, S 54 4 3 12 More Crane, Randy Texas, S 45 5 7 5 More Junell, Robert A. Texas, W 44 6 5 13 More Alvarez, Micaela Texas, S 38 7 8 3 More Hinojosa, Ricardo H. Texas, S 35 8 6 7 More Ramos, Nelva Gonzales Texas, S 35 8 10 - More Sabraw, Dana Makoto Cal, S 32 10 27 21 More Table 4. Top Ten Judges
All 10 of the "top ten" judges were in districts which were in the top ten with the largest number of filings per capit.
Judge Robert C. Brack in the District of New Mexico ranked 1st with 118 defendants in cases. Judge Brack appeared in the top ten rankings one year (ranked 4) and five years ago (rank 1).
Judge Alia Moses in the Western District of Texas (San Antonio) ranked 2nd with 97 defendants in cases. Judge Moses also appeared in the top ten rankings one year ago (ranked 2).
Judge Kenneth John Gonzales in the District of New Mexico ranked 3rd with 87 defendants in cases. Judge Gonzales also appeared in the top ten rankings one year ago (ranked 1).
Report Generated: April 7, 2015