IRS Criminal Prosecutions Rise Under Obama
by the Internal Revenue Service
| Bush (FY 2001 - 2008) |
Obama (FY 2009 - 2013) |
|
|---|---|---|
| Annual Referrals Received | 2,529 | 3,499 |
| Annual Prosecutions Filed | 1,303 | 1,568 |
| Percent Prosecuted* | 53.7% | 53.0% |
| Percent Declined* | 46.3% | 47.0% |
| Ave. Prison Sentence (months) | 25 | 27 |
| IRS Fulltime Criminal Investigators | 2,758 | 2,705 |
The average number of cases referred each year by the Internal Revenue Service (IRS) to federal prosecutors has risen by 38.4 percent during the Obama administration when compared with the Bush years. The number of these cases that get prosecuted by the government also rose, by 20.3 percent. Convictions are drawing slightly longer average prison terms — 27 months under Obama versus 25 months under Bush (see Table 1).
Note: an earlier version of this report incorrectly reported a 23.4 percent increase in prosecutions referred by the IRS.
For both administrations, the odds have been roughly 50-50 that federal prosecutors will accept an IRS referral for criminal prosecution. However, a surge in IRS criminal investigations referred under Obama has fueled an increase in the number of cases prosecuted. This has occurred even though the number of IRS fulltime criminal investigators has not grown: the average of 2,758 IRS criminal investigators during the Bush years has shrunk to 2,705 (a 2% drop) during the Obama administration.
The comparisons of the number of individuals referred to federal prosecutors by the IRS, as well as IRS staffing, are based on case-by-case information obtained by TRAC under the Freedom of Information Act from the Executive Office for United States Attorneys and the Office of Personnel Management.
Last year was a banner year for criminal prosecutions referred by the IRS. During FY 2013 the government reported 2,010 new prosecutions, a jump of 30.6 percent over the past fiscal year when the number of prosecutions totaled 1,539.
The long term trend in IRS criminal prosecutions going back to FY 1993 is shown more clearly in Figure 1. The vertical bars in Figure 1 represent the number of prosecutions recorded each fiscal year. Each presidential administration is distinguished by the color of the bars. Overall, the data show that prosecutions of this type are up 63.4 percent from the level of 1,230 reported in 2003.
However, the current level of criminal prosecution still falls short of what it was two decades ago. The FY 2013 total, for example, is down 27.4 percent from the level of 2,769 reported for FY 1993.
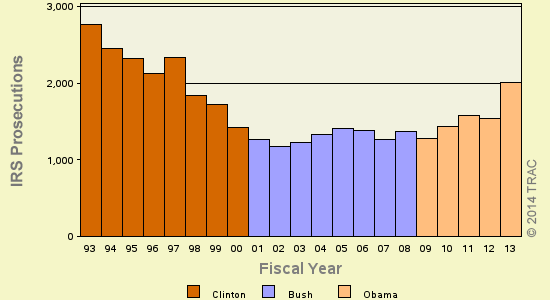
Figure 1. IRS Criminal Prosecutions Over The Past 20 Years
Top Ranked Lead Charges
Table 2 shows the top lead charges recorded in the prosecutions of IRS referrals filed in U.S. District Court during FY 2013, and how the rank for each charge has changed over the past 20 years.
| Lead Charge | Count FY 2013 |
Rank in FY | ||||
|---|---|---|---|---|---|---|
| 2013 | 2012 | 2008 | 2003 | 1993 | ||
| 26 USC 7206 Fraud and False statements |
230 | 1 | 1 | 2 | 1 | 2 |
| 26 USC 7201 Attempt to evade or defeat tax |
200 | 2 | 2 | 1 | 2 | 1 |
| 18 USC 641 Public money, property or records |
153 | 3 | 15 | 34 | 17 | 17 |
| 18 USC 371 Conspiracy to commit offense or to defraud US |
134 | 4 | 3 | 4 | 4 | 3 |
| 18 USC 287 False, fictitious or fraudulent claims |
125 | 5 | 4 | 5 | 7 | 6 |
| 18 USC 286 Conspiracy to defraud the Government claims |
119 | 6 | 5 | 8 | 5 | 10 |
| 18 USC 1956 Laundering of monetary instruments |
86 | 7 | 6 | 3 | 3 | 4 |
| 18 USC 1341 Mail Fraud - Frauds and swindles |
71 | 8 | 8 | 7 | 8 | 13 |
| 18 USC 1028 Fraud and related activity - id documents |
68 | 9 | 19 | 19 | 19 | 46 |
| 31 USC 5324 Structuring transactions to evade reporting requirements |
57 | 10 | 7 | 6 | 13 | 8 |
"Fraud and False statements" (Title 26 U.S.C Section 7206) was the most frequently recorded lead charge. This statute ranked first a year ago, while it was the second most frequently invoked five years ago. It was ranked first ten years ago and second twenty years ago.
Ranked second in frequency was the lead charge "Attempt to evade or defeat tax" under Title 26 U.S.C Section 7201. This statute was ranked second a year ago, while it was the most frequently invoked five years ago. It was ranked second ten years ago and first twenty years ago.
Ranked third was "Public money, property or records" under Title 18 U.S.C Section 641. It was ranked 17th ten and twenty years ago.
Among these top ten lead charges, the one showing the greatest increase in prosecutions — up 580 percent — compared to one year ago was Title 18 U.S.C Section 1028, involving "Fraud and related activity - id documents." This was the same statute that had the largest increase — 7550% — when compared with five years ago.
Top Ranked Judicial Districts
During FY 2012 the Justice Department said the government filed 4.9 prosecutions which were referred by the IRS for every one million people in the United States. This rose to 6.4 such prosecutions filed per one million people during FY 2013. Understandably, there is great variation in the per capita number of prosecutions in each of the nation's ninety-four federal judicial districts. Table 1 identifies the districts with the greatest number of IRS prosecutions per capita in FY 2013.
| Judicial District | Percapita | Count FY 2013 |
Rank in FY | ||||
|---|---|---|---|---|---|---|---|
| 2013 | 2012 | 2008 | 2003 | 1993 | |||
| Alaska | 53 | 38 | 1 | 12 | 2 | 11 | 1 |
| Ala, M | 30 | 35 | 2 | 1 | 30 | 68 | 80 |
| D. C. | 27 | 17 | 3 | 90 | 86 | 9 | 33 |
| W Virg, S | 22 | 20 | 4 | 20 | 1 | 3 | 21 |
| S Dakota | 18 | 15 | 5 | 53 | 86 | 40 | 58 |
| Cal, S | 18 | 60 | 6 | 22 | 57 | 1 | 7 |
| Fla, S | 17 | 117 | 7 | 4 | 6 | 5 | 6 |
| Ark, W | 14 | 18 | 8 | 60 | 76 | 59 | 59 |
| La, M | 12 | 10 | 9 | 2 | 82 | 87 | 77 |
| Nevada | 12 | 33 | 10 | 17 | 54 | 2 | 5 |
The District of Alaska — with 53.0 prosecutions as compared with 6.4 prosecutions per one million people in the United States — was the most active through September 2013.
The Middle District of Alabama (Montgomery) ranked second; it was ranked first a year ago. The district's position ten years ago was 68th and 80th twenty years ago.
The District of Washington, D.C. (Washington) now ranks third.
The federal judicial district which showed the greatest growth in the rate of prosecutions compared to one year ago — 534 percent — was Alaska. Compared to five years ago, the district with the largest growth — 858 percent — was the Middle District of Louisiana (Baton Rouge).