The latest available data from the Justice Department show that during FY 2014 the government reported 10,979 federal criminal convictions resulting from cases referred by the Federal Bureau of Investigation. The most common category of offense was narcotics/drugs, accounting for nearly one out of four (23.8%) convictions during FY 2014. The white collar crime category was a close second, accounting for 21.6 percent of all convictions.
No other offense type comprised more than 5 percent, the level found for weapons offenses. The next most frequent category for federal convictions was official corruption (2.6%). The remaining offenses were quite diverse, ranging from bank robbery to the sexual exploitation of minors. These results for all twelve months of FY 2014 derive from a detailed analysis of case-by-case information from the Executive Office for United States Attorneys, obtained by the Transactional Records Access Clearinghouse (TRAC) under the Freedom of Information Act.
Federal Districts Where the FBI Was Most Active
Understandably, the role of the FBI varies depending upon the federal district. It is not surprising that the District of Columbia with our nation's capital has the highest concentration of FBI activity relative to its population size, with over seven times the rate of FBI convictions compared with the national average.
But setting aside the nation's capital, the federal district with the next highest rate of FBI activity relative to its population was South Dakota which had more than five times the rate of FBI convictions compared with the nation as a whole.
In third place was Montana, with nearly four times the rate of FBI activity as reflected in the number of federal conviction convictions relative to its population size. The Southern District of Alabama (Mobile) was in fourth place with nearly three times the number of FBI convictions that would be expected given its population size. In fifth was the Southern District of California (San Diego) with over twice the number of convictions from FBI investigations that would be expected given its size.
Equally surprising were the bottom five districts which had the fewest convictions from FBI investigations relative to their population size. Ranking last in 90th place was the Western District of Wisconsin (Madison). During fiscal year 2014, it saw only one fourth the number of convictions from FBI investigations that would be expected relative to its population based upon the national figures. Next to the bottom ranked 89th was the Central District of California (Los Angeles) with only one third the number of convictions from FBI investigations that would be expected given its population size. Very close to the low activity in Los Angeles was that found in the Northern District of New York (Syracuse) which ranked 88th out of 90 and the Southern District of Iowa (Des Moines) which ranked 87th out of 90. Completing the bottom five ranked districts as to FBI investigations resulting in convictions was the Western District of Washington (Seattle) which ranked 86th out of 90.
The number as well as per capita rate of convictions during FY 2014 resulting from FBI referrals of all 90 federal districts that make up the fifty states are listed in Table 1. Rankings are shown for both the total number of convictions as well as the per capita rates.
Click on column header to sort table
| District | Number | Rate* | Rank (Number) | Rank (Rate) |
|---|---|---|---|---|
| Total | 10,979 | 34.98 | - | - |
| D. C. | 161 | 254.62 | 20 | 1 |
| S Dakota | 160 | 192.00 | 21 | 2 |
| Montana | 132 | 131.32 | 33 | 3 |
| Ala, S | 85 | 101.86 | 53 | 4 |
| Cal, S | 273 | 81.40 | 8 | 5 |
| Wash, E | 118 | 77.27 | 38 | 6 |
| N Dakota | 49 | 70.04 | 69 | 7 |
| Hawaii | 97 | 69.67 | 47 | 8 |
| Fla, S | 457 | 65.93 | 1 | 9 |
| Ken, E | 141 | 64.79 | 28 | 10 |
| Ga, S | 98 | 63.67 | 46 | 11 |
| Okla, N | 65 | 63.16 | 62 | 12 |
| N. Y., S | 325 | 63.04 | 2 | 13 |
| N Mexico | 122 | 58.50 | 34 | 14 |
| Okla, W | 115 | 56.42 | 39 | 15 |
| Tenn, W | 84 | 53.08 | 54 | 16 |
| Nevada | 144 | 52.19 | 27 | 17 |
| Vermont | 32 | 51.12 | 78 | 18 |
| Penn, E | 292 | 50.41 | 5 | 19 |
| La, W | 106 | 49.13 | 44 | 20 |
| Texas, E | 180 | 48.93 | 16 | 21 |
| Wyoming | 28 | 48.58 | 81 | 22 |
| Ohio, N | 278 | 48.23 | 6 | 23 |
| Tenn, E | 120 | 47.02 | 36 | 24 |
| Mo, E | 137 | 47.00 | 31 | 25 |
| Ill, S | 60 | 46.79 | 65 | 26 |
| Nebraska | 86 | 46.35 | 52 | 27 |
| Texas, W | 300 | 45.52 | 4 | 28 |
| Virg, E | 266 | 44.24 | 9 | 29 |
| Iowa, N | 58 | 43.75 | 66 | 30 |
| Ark, E | 71 | 43.41 | 58 | 31 |
| Ark, W | 57 | 43.39 | 67 | 32 |
| Ind, N | 111 | 43.19 | 42 | 33 |
| Mich, E | 275 | 42.64 | 7 | 34 |
| Ala, N | 115 | 40.50 | 39 | 35 |
| Ind, S | 157 | 39.57 | 23 | 36 |
| N Car, W | 121 | 39.57 | 35 | 36 |
| Ill, C | 89 | 39.45 | 51 | 38 |
| Conn | 141 | 39.27 | 28 | 39 |
| Arizona | 257 | 39.22 | 11 | 40 |
| La, E | 61 | 37.44 | 64 | 41 |
| Penn, W | 139 | 36.59 | 30 | 42 |
| W Virg, S | 34 | 36.58 | 76 | 43 |
| N. Y., W | 101 | 35.80 | 45 | 44 |
| Penn, M | 112 | 35.31 | 41 | 45 |
| S Car | 165 | 34.93 | 19 | 46 |
| Ala, M | 40 | 34.84 | 72 | 47 |
| Mo, W | 107 | 34.44 | 43 | 48 |
| Oregon | 133 | 34.11 | 32 | 49 |
| Ill, N | 313 | 33.52 | 3 | 50 |
| Delaware | 29 | 31.62 | 80 | 51 |
| Tenn, M | 71 | 30.58 | 58 | 52 |
| N. J. | 263 | 29.67 | 10 | 53 |
| Idaho | 47 | 29.45 | 70 | 54 |
| Miss, S | 54 | 28.87 | 68 | 55 |
| Utah | 79 | 27.67 | 55 | 56 |
| Ohio, S | 155 | 26.82 | 24 | 57 |
| Texas, N | 184 | 26.73 | 15 | 58 |
| Wisc, E | 90 | 26.58 | 50 | 59 |
| Alaska | 19 | 26.49 | 87 | 60 |
| Maryland | 155 | 26.34 | 24 | 61 |
| Maine | 35 | 26.33 | 75 | 62 |
| R. I. | 27 | 25.71 | 83 | 63 |
| N Car, E | 94 | 24.46 | 49 | 64 |
| Ga, N | 154 | 24.17 | 26 | 65 |
| N Car, M | 67 | 23.50 | 61 | 66 |
| Kansas | 64 | 22.18 | 63 | 67 |
| La, M | 18 | 22.08 | 88 | 68 |
| Cal, E | 169 | 21.80 | 18 | 69 |
| Miss, N | 24 | 21.53 | 84 | 70 |
| Fla, N | 38 | 21.41 | 73 | 71 |
| Texas, S | 189 | 21.22 | 14 | 72 |
| New Hamp | 28 | 21.20 | 81 | 73 |
| Fla, M | 224 | 21.11 | 12 | 74 |
| Mich, W | 72 | 20.97 | 56 | 75 |
| N. Y., E | 171 | 20.96 | 17 | 76 |
| Okla, E | 15 | 20.07 | 89 | 77 |
| Cal, N | 159 | 19.90 | 22 | 78 |
| Colorado | 97 | 18.70 | 47 | 79 |
| Mass | 120 | 18.06 | 36 | 80 |
| Virg, W | 37 | 17.03 | 74 | 81 |
| Ga, M | 33 | 16.42 | 77 | 82 |
| W Virg, N | 15 | 16.20 | 89 | 83 |
| Ken, W | 30 | 13.61 | 79 | 84 |
| Minnesota | 72 | 13.39 | 56 | 85 |
| Wash, W | 71 | 13.22 | 58 | 86 |
| Iowa, S | 22 | 12.58 | 86 | 87 |
| N. Y., N | 41 | 11.93 | 71 | 88 |
| Cal, C | 217 | 11.45 | 13 | 89 |
| Wisc, W | 23 | 9.83 | 85 | 90 |
Trends in Federal Convictions Resulting from FBI Investigations
When the number of defendants convicted of federal crimes resulting from FBI investigations for FY 2014 is compared with prior years, TRAC found that these FBI numbers are trending downward. This past year the total convictions were down 3.9 percent over the previous fiscal year, when the number of criminal convictions totaled 11,429. The FY 2014 total was 10.6 percent lower than the corresponding figure from ten years ago.
The long term trend in convictions for these matters going back to FY 1994 is shown more clearly in Figure 1, where the vertical bars represent the number of convictions of this type recorded each fiscal year. Each presidential administration is distinguished by the color of the bars. As shown on this chart, federal criminal convictions resulting from FBI investigations were trending upwards from FY 1994 to FY 1999. These convictions dipped in FY 2000 but then rose again and peaked shortly after 9/11.
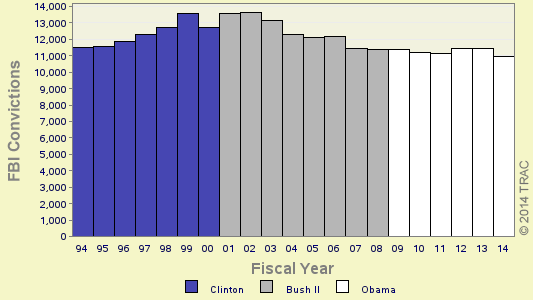
After the changes in the FBI's focus that began after 9/11, the nation has seen an overall decline in FBI investigations leading to criminal convictions. The sharpest drops occurred during the term of President George W. Bush, when FBI convictions fell from a peak of 13,663 during FY 2002 to 11,365 during FY 2008 — the last year of the Bush administration. Under President Obama, conviction numbers have ranged around this 11,365 level — slightly higher during FY 2009, 2012, 2013, and somewhat lower during FY 2010, FY 2011, and FY 2014.