| Bush (FY 2001 -2008) |
Obama (FY 2009 -2013) |
|
|---|---|---|
| Annual Referrals Received | 31,184 | 25,953 |
| Annual Prosecutions Filed | 16,061 | 14,573 |
| Percent Prosecuted* | 51.7% | 58.1% |
| Percent Declined* | 48.3% | 41.9% |
| Ave. Prison Sentence (months) | 66 | 77 |
| FBI Fulltime Criminal Investigators | 11,990 | 13,596 |
However, the Bush administration figures were higher at the beginning of his term than at the end, when they were at similar levels to what is seen during the Obama years. The long term trend in FBI criminal prosecutions going back to FY 1993 is shown more clearly in Figure 1. The vertical bars in Figure 1 represent the number of prosecutions recorded each fiscal year. Each presidential administration is distinguished by the color of the bars.
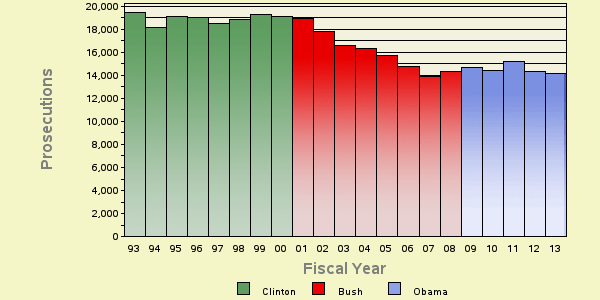
Figure 1 shows that prosecutions, which averaged just under 19,000 during the Clinton years, began falling under President Bush as the FBI's attention shifted to combating terrorism (such efforts do not necessarily result in criminal prosecutions). The FY 2013 total, for example, is down 27 percent from the level of 19,437 reported for FY 1993. Criminal prosecution levels fell throughout the Bush years and have stabilized somewhat under President Obama.
Last year had the lowest number of FBI prosecutions during Obama's tenure, 14,184. With the exception of FY 2007, an anomalous year in this regard, FY 2013 saw the lowest number of FBI prosecutions since FY 1988.
Other comparisons show some improvement in performance during the Obama administration. For example, a larger proportion of FBI referrals are being accepted by federal prosecutors. During the Bush years only about half (51.7%) of FBI referrals resulted in prosecutions; under Obama this has risen to 58.1 percent. In addition, convictions are drawing longer average prison terms — 77 months under Obama versus 66 months under Bush. See Table 1.
The figures on the number of individuals referred to federal prosecutors by the FBI, as well as FBI staffing, are based on case-by-case information obtained by TRAC under the Freedom of Information Act from the Executive Office for United States Attorneys and the Office of Personnel Management.
Top Ranked Judicial Districts
During FY 2012 the Justice Department said the government obtained 45.7 prosecutions for every one million people in the United States. This number declined only slightly to 45.2 prosecutions for one million people during FY 2013. Understandably, there is great variation in the per capita number of prosecutions in each of the nation's ninety-four federal judicial districts.
As might be expected, the nation's capital heads the list as the most active district. What is more surprising is the concentration of more rural districts in the top ten. For example, the District of South Dakota ranked second. It was also ranked second a year ago, and was ranked first five years ago. In third place was the District of Montana. The District of Montana was also ranked third a year ago as well as five years ago. See Table 2.
Outside of D.C., the first district on this list with a major metropolitan center is the Southern District of New York (Manhattan), which falls in eighth place. In addition, last year, the judicial district recording the largest drop in the rate of prosecutions — 16.4 percent — was also New York South.
The federal judicial district which showed the greatest growth in the rate of prosecutions compared to one year ago — 86.7 percent — was the Eastern District of Washington (Spokane). Compared to five years ago, the district with the largest growth — 175 percent — was Hawaii.
| Judicial District |
Percapita | Count FY 2013 |
Rank in FY | ||||
|---|---|---|---|---|---|---|---|
| 2013 | 2012 | 2008 | 2003 | 1993 | |||
| D. C. | 376 | 238 | 1 | 1 | 2 | 1 | 1 |
| S Dakota | 206 | 172 | 2 | 2 | 1 | 3 | 10 |
| Montana | 185 | 186 | 3 | 3 | 3 | 2 | 5 |
| N Dakota | 177 | 124 | 4 | 6 | 5 | 14 | 52 |
| Okla, W | 114 | 232 | 5 | 16 | 32 | 45 | 12 |
| N Mexico | 109 | 228 | 6 | 7 | 7 | 7 | 38 |
| Wash, E | 101 | 155 | 7 | 28 | 30 | 54 | 59 |
| N. Y., S | 94 | 483 | 8 | 5 | 6 | 6 | 6 |
| Hawaii | 88 | 122 | 9 | 41 | 62 | 15 | 54 |
| Fla, S | 88 | 607 | 10 | 8 | 7 | 16 | 9 |
Top Ranked Lead Charges
Table 2 shows the top lead charges recorded in the prosecutions of FBI referrals filed in U.S. District Court during FY 2013, and how the rank for each charge has changed over the past 20 years.
| Lead Charge | Count FY 2013 |
Rank in FY | ||||
|---|---|---|---|---|---|---|
| 2013 | 2012 | 2008 | 2003 | 1993 | ||
| 21 USC 841 Drug Abuse Prevention & Control-Prohibited acts A |
1,519 | 1 | 2 | 1 | 3 | 4 |
| 21 USC 846 Attempt and conspiracy |
1,330 | 2 | 1 | 3 | 2 | 3 |
| 18 USC 2113 Bank robbery and incidental crimes |
941 | 3 | 3 | 2 | 1 | 1 |
| 18 USC 2252 Material involving sexual exploitation of minors |
592 | 4 | 5 | 4 | 12 | 136 |
| 18 USC 1343 Fraud by wire, radio, or television |
562 | 5 | 4 | 10 | 8 | 9 |
| 18 USC 922 Firearms; Unlawful acts |
485 | 6 | 6 | 12 | 10 | 19 |
| 18 USC 1951 Hobbs Act |
424 | 7 | 11 | 11 | 11 | 11 |
| 18 USC 371 Conspiracy to commit offense or to defraud US |
369 | 8 | 8 | 5 | 7 | 6 |
| 18 USC 1349 Mail Fraud - Attempt and Conspiracy |
363 | 9 | 10 | 14 | 227 | - |
| 18 USC 1341 Mail Fraud - Frauds and swindles |
300 | 10 | 7 | 8 | 5 | 8 |
- The most frequently recorded lead charge was "Drug Abuse Prevention & Control-Prohibited acts A" (Title 21 U.S.C. Section 841). This statute was ranked 2nd a year ago, while it was the most frequently invoked lead charge five years ago.
- Ranked second in frequency was the lead charge "Attempt and conspiracy" under Title 21 U.S.C. Section 846. This statute was ranked 1st a year ago, and was the third most frequently invoked lead charge five years ago.
- Ranked third was "Bank robbery and incidental crimes" under Title 18 U.S.C. Section 2113. This statute was also ranked third a year ago, while it was the second most frequently invoked lead charge five years ago.
Among these top ten lead charges, the one showing the greatest increase in prosecutions — up 23.6 percent compared to one year ago — was Title 18 U.S.C. Section 1951 that involves the Hobbs Act. This was the same statute that had the largest increase — 96.2 percent — compared with five years ago.
Again among the top ten lead charges, the one showing the sharpest decline in prosecutions compared to one year ago — down 26.8 percent — was "Mail Fraud - Frauds and swindles" (Title 18 U.S.C. Section 1341). This was the same statute that had the largest decrease — 36.3 percent — compared with five years ago.
[1] For detailed information about how referrals are handled by the U.S. Attorney's Offices, see About the Data: Federal Prosecutor Data.