"Zero Tolerance" at the Border: Rhetoric vs. Reality
The latest available case-by-case records for May 2018 reveal a total of 9,216 new federal prosecutions were brought as a result of referrals from Customs and Border Protection (CBP) in the five federal judicial districts along the southwest border. May numbers were up 11.1 percent from the 8,298 such prosecutions recorded during April, and up 44.7 percent over March figures. This increase follows Attorney General Jeff Sessions' April 6, 2018 announcement, of a "zero-tolerance policy" for those who "illegally cross over our border."
While the policy has resulted in an increase in criminal prosecutions, the so-called "zero-tolerance" as implemented continued to fall far short of the reality on the ground. During May southwest border apprehensions continued to dwarf the number of criminal prosecutions. In May 2018, CBP reported that the Border Patrol apprehended 40,338 individuals along the southwest border trying to illegally enter the country. And this does not count individuals at ports-of-entry who were found seeking to unlawfully enter using fraudulent documents, or individuals caught at ports-of-entry illegally smuggling individuals, drugs, or cargo.
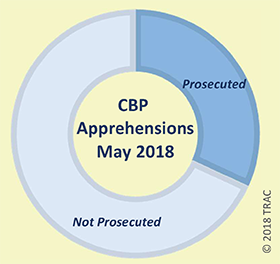
Figure 1: Criminal Immigration Prosecutions
over the last 20 years
In May 2018, a generous estimate indicates criminal prosecutions were still at most only 32 percent of total Border Patrol apprehensions. See Figure 1. This estimate eliminates apprehensions of children who presumably weren't subject to the zero-tolerance prosecution policy, and also excludes arrests at ports of entry. Including either or both of these groups would result in criminal prosecutions numbers representing an even smaller proportion of total CBP apprehensions.
These prosecution counts are based upon government case-by-case records on each prosecution referred by CBP to U.S. Attorney offices[1]. Obtained as the result of successful litigation brought by the co-directors of the Transactional Records Access Clearinghouse (TRAC) at Syracuse University, these detailed records were analyzed by TRAC to gauge progress on the implementation of the Administration's zero-tolerance policy. Estimated Border Patrol apprehensions that exclude children (those under 18 who were apprehended as part of a family unit or unaccompanied) use Border Patrol records also obtained by TRAC with the age of each person who was taken into custody[2]. For additional results, see last month's TRAC report on southwest border prosecutions.
Zero-Tolerance and Family Separations
Family separations, the Administration stated, was the inevitable consequence of prosecuting everyone caught illegally entering this country. As the press widely reported, "[t]he Justice Department can't prosecute children along with their parents, so the natural result of the zero-tolerance policy has been a sharp rise in family separations. Nearly 2,000 immigrant children were separated from parents during six weeks in April and May, according to the Department of Homeland Security."[3]
However, since less than a third of adults apprehended illegally crossing the border were actually referred for prosecution, the stated justification does not explain why this Administration chose to prosecute parents with children over prosecuting adults without children who were also apprehended in even larger numbers. As shown in Table 1, the total number of adults apprehended without children during May 2018 was 24,465. This is much larger than the 9,216 adults that the administration chose to prosecute that month.
| Southwest Border | Apr 2018 | May 2018 |
| Criminal Prosecutions: | ||
| Referred by CBP | 8,298 | 9,216 |
| Border Patrol Apprehensions: | ||
| Adults without Children | 24,299 | 24,465 |
| Adults with Children | 4,536 | 4,458 |
Thus, the so-called zero-tolerance policy didn't as a practical matter eliminate prosecutorial discretion. Since less than one out of three adults were actually prosecuted, CBP personnel had to choose which individuals among those apprehended to refer to federal prosecutors[4]. The Administration has not explained its rationale for prosecuting parents with children when that left so many other adults without children who were not being referred for prosecution.
Nor does the zero-tolerance policy explain why so many adults also had their children taken from them who were not prosecuted. For more background, see TRAC's report on the latest case-by-case Border Patrol data.
Where Along the Southwest Border Were Prosecutions in May Concentrated?
While CBP criminal prosecutions increased in all five federal judicial districts long the southwest border in April, trends diverged during May. The most prosecutions during May (3,996) occurred in the Southern District of Texas - with double the number (1,959) that had occurred during April. The Southern District of California also recorded an increase. That district had the lowest number in April among the five border districts, but climbed past New Mexico's prosecution numbers in May.
In contrast, the number of recorded prosecutions actually fell in the Western District of Texas in May. During April, that district had recorded the largest number among the five districts with 2,767 prosecutions. Prosecutions during May in West Texas fell to 2,308. As shown in Table 2, May totals were also somewhat lower in Arizona and New Mexico than April prosecution numbers.
Federal prosecutors also reported prosecutions within districts by the specific border community where they were stationed. Trends in each of these specific border areas within the five districts along the southwest border are shown in Table 3.
In May, among these border areas, prosecutions from CBP referrals were highest in McAllen, Texas in the Southern District of Texas. A total of 2,079 prosecutions were recorded there in May alone - up from 841 in April. Prosecutions also rose in Brownsville, Corpus Christi, and Del Rio, Texas, as well as in Yuma, Arizona.
Other communities experienced declines. While Tucson, Arizona, had the largest number of recorded prosecutions during April (1,392), its numbers in May fell to 1,149. Despite this decline, in May Tucson, still had the third largest total for criminal prosecutions, just below prosecution numbers in Del Rio, Texas. Las Cruces, New Mexico, Laredo and Pecos/Alpine, Texas also saw declines.
(click title to open in a new window)
| Year and Month | Total SW Border | Arizona | Cal, S. | N. Mexico | Texas, S | Texas, W. |
|---|---|---|---|---|---|---|
| 2007-05 | 2,765 | 1,115 | 334 | 164 | 991 | 161 |
| 2007-06 | 2,769 | 979 | 247 | 165 | 1,202 | 176 |
| 2007-07 | 2,181 | 658 | 328 | 174 | 811 | 210 |
| 2007-08 | 2,813 | 658 | 414 | 216 | 1,224 | 301 |
| 2007-09 | 3,422 | 575 | 406 | 209 | 1,810 | 422 |
| 2007-10 | 3,119 | 589 | 228 | 137 | 1,839 | 326 |
| 2007-11 | 2,351 | 402 | 307 | 156 | 1,319 | 167 |
| 2007-12 | 2,944 | 422 | 345 | 107 | 1,342 | 728 |
| 2008-01 | 3,014 | 965 | 332 | 131 | 990 | 596 |
| 2008-02 | 5,343 | 1,241 | 422 | 146 | 1,052 | 2,482 |
| 2008-03 | 7,169 | 1,571 | 577 | 556 | 1,232 | 3,233 |
| 2008-04 | 6,844 | 1,796 | 398 | 815 | 1,287 | 2,548 |
| 2008-05 | 6,977 | 1,657 | 407 | 824 | 2,512 | 1,577 |
| 2008-06 | 7,500 | 1,644 | 567 | 820 | 3,038 | 1,431 |
| 2008-07 | 6,900 | 1,639 | 371 | 604 | 2,395 | 1,891 |
| 2008-08 | 5,108 | 1,248 | 356 | 416 | 1,755 | 1,333 |
| 2008-09 | 9,893 | 1,667 | 648 | 733 | 5,024 | 1,821 |
| 2008-10 | 7,611 | 1,757 | 266 | 438 | 4,058 | 1,092 |
| 2008-11 | 5,667 | 1,413 | 208 | 387 | 2,728 | 931 |
| 2008-12 | 5,234 | 1,483 | 382 | 313 | 2,154 | 902 |
| 2009-01 | 5,685 | 1,638 | 281 | 391 | 1,772 | 1,603 |
| 2009-02 | 5,683 | 1,763 | 251 | 423 | 1,497 | 1,749 |
| 2009-03 | 7,044 | 1,974 | 360 | 578 | 2,078 | 2,054 |
| 2009-04 | 6,565 | 1,857 | 357 | 553 | 2,317 | 1,481 |
| 2009-05 | 5,599 | 1,736 | 201 | 515 | 1,841 | 1,306 |
| 2009-06 | 7,482 | 2,152 | 274 | 508 | 3,266 | 1,282 |
| 2009-07 | 7,110 | 2,205 | 245 | 529 | 3,064 | 1,067 |
| 2009-08 | 6,582 | 1,833 | 292 | 620 | 2,785 | 1,052 |
| 2009-09 | 7,346 | 2,190 | 559 | 643 | 2,545 | 1,409 |
| 2009-10 | 5,767 | 2,035 | 235 | 396 | 2,213 | 888 |
| 2009-11 | 5,221 | 2,341 | 262 | 325 | 1,709 | 584 |
| 2009-12 | 5,454 | 1,616 | 273 | 303 | 1,929 | 1,333 |
| 2010-01 | 4,535 | 1,761 | 253 | 359 | 1,283 | 879 |
| 2010-02 | 5,149 | 1,703 | 357 | 408 | 1,518 | 1,163 |
| 2010-03 | 6,798 | 2,502 | 315 | 603 | 1,761 | 1,617 |
| 2010-04 | 7,691 | 2,465 | 387 | 709 | 2,269 | 1,861 |
| 2010-05 | 7,451 | 2,756 | 316 | 608 | 2,308 | 1,463 |
| 2010-06 | 6,784 | 2,869 | 312 | 433 | 1,953 | 1,217 |
| 2010-07 | 5,476 | 2,762 | 276 | 283 | 1,166 | 989 |
| 2010-08 | 5,616 | 2,652 | 351 | 319 | 1,427 | 867 |
| 2010-09 | 6,714 | 2,075 | 879 | 309 | 2,428 | 1,023 |
| 2010-10 | 5,021 | 1,992 | 250 | 275 | 1,541 | 963 |
| 2010-11 | 5,012 | 1,962 | 290 | 271 | 1,632 | 857 |
| 2010-12 | 4,295 | 1,901 | 253 | 188 | 1,235 | 718 |
| 2011-01 | 4,187 | 1,653 | 221 | 242 | 1,539 | 532 |
| 2011-02 | 5,037 | 1,873 | 275 | 320 | 1,635 | 934 |
| 2011-03 | 6,592 | 2,623 | 240 | 632 | 2,169 | 928 |
| 2011-04 | 7,585 | 2,840 | 304 | 618 | 2,140 | 1,683 |
| 2011-05 | 6,664 | 2,620 | 320 | 499 | 1,901 | 1,324 |
| 2011-06 | 6,773 | 2,692 | 391 | 372 | 1,964 | 1,354 |
| 2011-07 | 5,401 | 1,813 | 426 | 318 | 1,588 | 1,256 |
| 2011-08 | 6,258 | 2,236 | 435 | 310 | 2,115 | 1,162 |
| 2011-09 | 6,390 | 1,869 | 689 | 302 | 2,293 | 1,237 |
| 2011-10 | 6,210 | 2,504 | 315 | 246 | 1,788 | 1,357 |
| 2011-11 | 5,358 | 2,259 | 324 | 188 | 1,768 | 819 |
| 2011-12 | 4,817 | 1,813 | 247 | 178 | 1,448 | 1,131 |
| 2012-01 | 5,867 | 2,504 | 226 | 251 | 1,667 | 1,219 |
| 2012-02 | 6,041 | 2,393 | 247 | 351 | 1,832 | 1,218 |
| 2012-03 | 6,532 | 2,236 | 290 | 448 | 1,953 | 1,605 |
| 2012-04 | 7,772 | 2,978 | 248 | 411 | 2,265 | 1,870 |
| 2012-05 | 8,527 | 2,786 | 354 | 339 | 2,331 | 2,717 |
| 2012-06 | 7,356 | 3,683 | 288 | 420 | 1,940 | 1,025 |
| 2012-07 | 7,751 | 2,952 | 336 | 328 | 2,304 | 1,831 |
| 2012-08 | 7,296 | 1,905 | 335 | 487 | 3,081 | 1,488 |
| 2012-09 | 7,159 | 2,210 | 487 | 497 | 2,886 | 1,079 |
| 2012-10 | 6,169 | 2,317 | 267 | 516 | 2,346 | 723 |
| 2012-11 | 7,232 | 2,111 | 280 | 412 | 2,193 | 2,236 |
| 2012-12 | 9,268 | 1,911 | 263 | 341 | 3,402 | 3,351 |
| 2013-01 | 7,760 | 2,152 | 227 | 384 | 2,715 | 2,282 |
| 2013-02 | 6,143 | 1,794 | 230 | 519 | 1,761 | 1,839 |
| 2013-03 | 7,890 | 1,867 | 226 | 581 | 3,219 | 1,997 |
| 2013-04 | 8,228 | 2,323 | 232 | 620 | 2,838 | 2,215 |
| 2013-05 | 8,083 | 1,542 | 268 | 737 | 3,298 | 2,238 |
| 2013-06 | 6,636 | 2,214 | 213 | 525 | 2,302 | 1,382 |
| 2013-07 | 6,705 | 2,189 | 233 | 502 | 1,900 | 1,881 |
| 2013-08 | 6,440 | 2,165 | 239 | 466 | 2,193 | 1,377 |
| 2013-09 | 6,454 | 2,053 | 385 | 503 | 1,919 | 1,594 |
| 2013-10 | 5,826 | 2,209 | 222 | 261 | 1,990 | 1,144 |
| 2013-11 | 5,529 | 1,911 | 210 | 238 | 1,795 | 1,375 |
| 2013-12 | 5,356 | 2,335 | 262 | 224 | 1,421 | 1,114 |
| 2014-01 | 4,959 | 2,309 | 215 | 192 | 1,069 | 1,174 |
| 2014-02 | 5,434 | 2,195 | 202 | 264 | 1,395 | 1,378 |
| 2014-03 | 5,810 | 2,178 | 239 | 292 | 1,404 | 1,697 |
| 2014-04 | 7,398 | 2,462 | 331 | 356 | 2,346 | 1,903 |
| 2014-05 | 7,070 | 2,598 | 263 | 318 | 2,235 | 1,656 |
| 2014-06 | 6,543 | 2,121 | 303 | 325 | 1,932 | 1,862 |
| 2014-07 | 8,091 | 1,729 | 215 | 321 | 4,500 | 1,326 |
| 2014-08 | 7,590 | 1,919 | 242 | 280 | 4,137 | 1,012 |
| 2014-09 | 8,857 | 2,455 | 502 | 441 | 3,967 | 1,492 |
| 2014-10 | 6,254 | 2,315 | 251 | 279 | 2,247 | 1,162 |
| 2014-11 | 4,705 | 1,755 | 228 | 254 | 1,507 | 961 |
| 2014-12 | 5,717 | 2,027 | 201 | 291 | 2,218 | 980 |
| 2015-01 | 4,514 | 1,669 | 224 | 247 | 1,748 | 626 |
| 2015-02 | 5,344 | 1,739 | 231 | 248 | 1,901 | 1,225 |
| 2015-03 | 6,398 | 2,012 | 295 | 372 | 2,655 | 1,064 |
| 2015-04 | 6,300 | 1,715 | 229 | 406 | 2,114 | 1,836 |
| 2015-05 | 5,782 | 1,658 | 252 | 285 | 1,948 | 1,639 |
| 2015-06 | 5,887 | 1,344 | 240 | 350 | 2,360 | 1,593 |
| 2015-07 | 5,370 | 1,214 | 229 | 385 | 2,140 | 1,402 |
| 2015-08 | 5,191 | 1,451 | 205 | 322 | 1,932 | 1,281 |
| 2015-09 | 6,286 | 1,465 | 279 | 471 | 2,526 | 1,545 |
| 2015-10 | 5,206 | 1,429 | 184 | 314 | 2,039 | 1,240 |
| 2015-11 | 4,454 | 967 | 147 | 322 | 1,863 | 1,155 |
| 2015-12 | 5,849 | 1,083 | 169 | 370 | 2,438 | 1,789 |
| 2016-01 | 4,816 | 1,221 | 147 | 271 | 2,057 | 1,120 |
| 2016-02 | 5,118 | 1,366 | 185 | 321 | 2,269 | 977 |
| 2016-03 | 6,608 | 1,366 | 234 | 429 | 2,532 | 2,047 |
| 2016-04 | 6,170 | 1,614 | 180 | 444 | 2,254 | 1,678 |
| 2016-05 | 6,010 | 1,365 | 209 | 588 | 2,099 | 1,749 |
| 2016-06 | 5,275 | 1,242 | 274 | 379 | 1,367 | 2,013 |
| 2016-07 | 4,028 | 1,168 | 252 | 207 | 1,014 | 1,387 |
| 2016-08 | 4,588 | 1,151 | 287 | 280 | 1,312 | 1,558 |
| 2016-09 | 5,028 | 1,189 | 415 | 402 | 1,608 | 1,414 |
| 2016-10 | 4,156 | 1,119 | 224 | 229 | 1,230 | 1,354 |
| 2016-11 | 4,700 | 1,366 | 207 | 246 | 1,123 | 1,758 |
| 2016-12 | 4,396 | 989 | 225 | 229 | 1,069 | 1,884 |
| 2017-01 | 4,013 | 1,250 | 228 | 219 | 1,078 | 1,238 |
| 2017-02 | 3,773 | 1,056 | 230 | 241 | 1,070 | 1,176 |
| 2017-03 | 3,849 | 1,161 | 267 | 214 | 1,160 | 1,047 |
| 2017-04 | 3,150 | 863 | 207 | 210 | 972 | 898 |
| 2017-05 | 3,807 | 1,311 | 257 | 305 | 1,205 | 729 |
| 2017-06 | 4,728 | 1,702 | 308 | 496 | 1,164 | 1,058 |
| 2017-07 | 4,467 | 1,472 | 287 | 564 | 1,300 | 844 |
| 2017-08 | 5,076 | 1,610 | 389 | 663 | 1,277 | 1,137 |
| 2017-09 | 5,577 | 1,489 | 627 | 766 | 1,191 | 1,504 |
| 2017-10 | 5,077 | 1,451 | 354 | 748 | 1,321 | 1,203 |
| 2017-11 | 4,320 | 1,257 | 354 | 610 | 780 | 1,319 |
| 2017-12 | 4,279 | 1,226 | 378 | 487 | 939 | 1,249 |
| 2018-01 | 5,191 | 1,422 | 432 | 563 | 1,417 | 1,357 |
| 2018-02 | 4,937 | 1,111 | 472 | 586 | 1,478 | 1,290 |
| 2018-03 | 6,368 | 1,443 | 541 | 844 | 1,905 | 1,635 |
| 2018-04 | 8,298 | 1,671 | 720 | 1,181 | 1,959 | 2,767 |
| 2018-05 | 9,216 | 1,411 | 764 | 737 | 3,996 | 2,308 |
| May vs Apr '18 | 11.1% | -15.6% | 6.1% | -37.6% | 104.0% | -16.6% |
| May vs Mar '18 | 44.7% | -2.2% | 41.2% | -12.7% | 109.8% | 41.2% |
| Federal District* | Total | Jan 2018 | Feb 2018 | Mar 2018 | Apr 2018 | May 2018 |
|---|---|---|---|---|---|---|
| Southwest Border | 34,010 | 5,191 | 4,937 | 6,368 | 8,298 | 9,216 |
| Arizona | ||||||
| Phoenix | 566 | 97 | 94 | 157 | 163 | 55 |
| Tucson | 5,644 | 1,065 | 896 | 1,142 | 1,392 | 1,149 |
| Yuma | 860 | 262 | 123 | 145 | 119 | 211 |
| California, S | ||||||
| El Centro | 744 | 115 | 166 | 166 | 128 | 169 |
| Imperial County | 3 | 0 | 0 | 0 | 0 | 3 |
| San Diego | 2,170 | 315 | 304 | 374 | 589 | 588 |
| New Mexico | ||||||
| Albuquerque | 227 | 26 | 31 | 39 | 86 | 45 |
| Las Cruces | 3,684 | 537 | 555 | 805 | 1,095 | 692 |
| Texas, S | ||||||
| Brownsville | 1,420 | 159 | 124 | 140 | 223 | 774 |
| Corpus Christi | 813 | 75 | 52 | 80 | 129 | 477 |
| Houston | 8 | 1 | 3 | 0 | 1 | 3 |
| Laredo | 3,668 | 552 | 741 | 971 | 761 | 643 |
| McAllen | 4,815 | 625 | 557 | 713 | 841 | 2,079 |
| Victoria | 31 | 5 | 1 | 1 | 4 | 20 |
| Texas, W | ||||||
| Austin | 116 | 12 | 15 | 13 | 44 | 32 |
| Del Rio | 4,340 | 584 | 570 | 937 | 1,024 | 1,225 |
| El Paso | 3,357 | 706 | 596 | 555 | 894 | 606 |
| Midland | 3 | 0 | 1 | 2 | 0 | 0 |
| Pecos/Alpine | 1,541 | 55 | 108 | 128 | 805 | 445 |
Footnotes
[1] Figures also included illegal entry and illegal re-entry referrals that federal prosecutors recorded as coming from U.S. Citizenship and Immigration Services since during past periods actual apprehensions appear to have been by CBP.
[2] This case-by-case data providing a breakdown of adults versus children making up apprehended family units can be viewed at: http://trac.syr.edu/phptools/immigration/cbparrest/. Both in March and in April 2018, children made up 53 percent of the individual apprehended in family units. For May, this same ratio was used in deriving the proportion of adults prosecuted.
[3] See, for example, June 19, 2018 Washington Post article at: https://www.washingtonpost.com/news/fact-checker/wp/2018/06/19/the-facts-about-trumps-policy- of-separating-families-at-the-border/
[4] Virtually every CBP referral results in prosecution. For example, during May 2018, federal prosecutors recorded only declining to prosecute 10 CBP referrals. Every referral in Arizona, New Mexico, and the Western District of Texas was prosecuted, none were declined. While in the Southern District of California and the Southern District of Texas, 99.7 percent and 99.8 percent, respectively, were prosecuted.