Immigration Criminal Prosecutions Jump in March 2018
The latest available data from the Justice Department show that during March 2018 the government reported 7,020 new immigration prosecutions. According to the case-by-case information analyzed by the Transactional Records Access Clearinghouse (TRAC), this number is up 23.9 percent over the previous month. This brought the total for the first six months of FY 2018 to 35,787 new immigration prosecutions.
If this activity continues at the same pace for the remaining half of this fiscal year, the annual total of prosecutions will be 71,574 - up 19.5% over the past fiscal year when the number of prosecutions totaled 59,910.
| Number Year-to-date | 35,787 |
| Percent Change from previous year | 19.5 |
| Percent Change from 5 years ago | -26.5 |
| Percent Change from 10 years ago | -9.9 |
| Percent Change from 20 years ago | 400 |
The comparisons of the number of defendants charged with immigration-related offenses are based on case-by-case information obtained by TRAC under the Freedom of Information Act from the Executive Office for United States Attorneys (see Table 1).
Compared to five years ago when there were 97,384, the estimate of FY 2018 prosecutions of this type is down 26.5 percent. Prosecutions over the past year are lower than they were ten years ago. Overall, the data show that prosecutions of this type are down 9.9 percent from the level of 79,431 reported in 2008 but up 400 percent from the level of 14,309 reported in 1998.
The long term trend in immigration prosecutions for these matters going back to FY 1998 is shown more clearly in Figure 1. The vertical bars in Figure 1 represent the number of immigration prosecutions of this type recorded each fiscal year. Projected figures for the current fiscal year are shown. Each presidential administration is distinguished by the color of the bars.
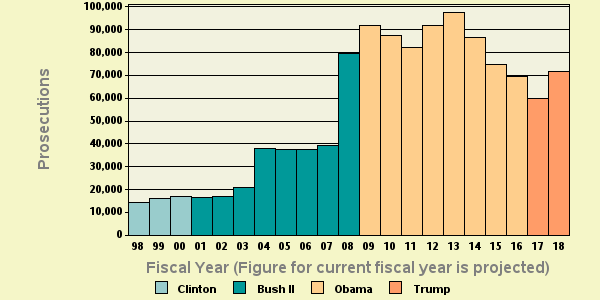
Figure 1: Criminal Immigration Prosecutions over the last 20 years
Leading Investigative Agencies
The lead investigative agency for immigration prosecutions through March 2018 was "Homeland Security - Customs and Border Protection" accounting for 86.1 percent of prosecutions referred.
Additional agencies with substantial numbers of immigration referrals were Homeland Security - Immigration and Customs Enforcement (11.5%).
Top Ranked Lead Charges
Table 2 shows the top lead charges recorded in the prosecutions of immigration matters filed in U.S. District Court during the first six months of FY 2018. Note: There were an additional 76 other lead charges which were not individually ranked. See latest monthly report if you want all lead charges included in rankings for the latest month.
| Lead Charge | Count | Rank | 1 yr ago | 5 yrs ago | 10 yrs ago | 20 yrs ago |
|---|---|---|---|---|---|---|
| 08 USC 1325 - Entry of alien at improper time or place; etc. | 18,361 | 1 | 2 | 1 | 1 | 2 |
| 08 USC 1326 - Reentry of deported alien | 14,402 | 2 | 1 | 2 | 2 | 1 |
| 08 USC 1324 - Bringing in and harboring certain aliens | 2,153 | 3 | 3 | 3 | 3 | 3 |
| 18 USC 1546 - Fraud and misuse of visas, permits, and other documents | 343 | 4 | 4 | 4 | 4 | 4 |
| 18 USC 1544 - Misuse of passport | 171 | 5 | 5 | 5 | 13 | 23 |
| 18 USC 922 - Firearms; Unlawful acts | 40 | 6 | 8 | 12 | 16 | 16 |
| 18 USC 1542 - False statement in application and use of passport | 32 | 7 | 7 | 8 | 8 | 7 |
| 18 USC 1028 - Fraud and related activity - id documents | 30 | 8 | 6 | 6 | 5 | 6 |
| 21 USC 841 - Drug Abuse Prevention & Control-Prohibited acts A | 26 | 9 | 11 | 13 | 15 | 11 |
| 18 USC 3144 - Release or detention of a material witness | 23 | 10 | 12 | 22 | 17 | 13 |
"Entry of alien at improper time or place; etc." (Title 8 U.S.C Section 1325) was the most frequent recorded lead charge. Title 8 U.S.C Section 1325 was ranked 2nd a year ago, while it was the 1st most frequently invoked five years ago. It was ranked 1st ten years ago and 2nd twenty years ago.
Ranked 2nd in frequency was the lead charge "Reentry of deported alien" under Title 8 U.S.C Section 1326. Title 8 U.S.C Section 1326 was ranked 1st a year ago, while it was the 2nd most frequently invoked five years ago. It was ranked 2nd ten years ago and 1st twenty years ago.
Ranked 3rd was "Bringing in and harboring certain aliens" under Title 8 U.S.C Section 1324. Title 8 U.S.C Section 1324 was ranked 3rd a year ago, while it was the 3rd most frequently invoked five years ago. It was ranked 3rd ten years ago and 3rd twenty years ago.
Again among the top ten lead charges, the one showing the sharpest projected decline in prosecutions compared to one year ago-down -41 percent-was "Fraud and related activity - id documents " (Title 18 U.S.C Section 1028 ). This was the same statute that had the largest projected decrease—84%—when compared with five years ago.
Top Ranked Judicial Districts
Understandably, there is great variation in the number of immigration prosecutions in each of the nation's ninety-four federal judicial districts. The districts registering the largest number of prosecutions of this type during the first six months of FY 2018 are shown in Table 3.
| Judicial District | Count | Rank | 1yr ago | 5yrs ago | 10yrs ago | 20yrs ago |
|---|---|---|---|---|---|---|
| Texas, W | 9,055 | 1 | 1 | 2 | 2 | 3 |
| Texas, S | 8,573 | 2 | 3 | 1 | 1 | 4 |
| Arizona | 8,394 | 3 | 2 | 3 | 3 | 1 |
| N Mexico | 4,108 | 4 | 4 | 4 | 4 | 6 |
| Cal, S | 2,648 | 5 | 5 | 5 | 5 | 2 |
| Fla, S | 294 | 6 | 6 | 6 | 7 | 13 |
| Fla, M | 181 | 7 | 8 | 9 | 8 | 9 |
| Texas, N | 137 | 8 | 9 | 8 | 9 | 12 |
| Utah | 131 | 9 | 7 | 12 | 11 | 8 |
| Mich, E | 106 | 10 | 10 | 13 | 50 | 46 |
The Western District of Texas (San Antonio)-with 9,055 prosecutions-was the most active through March 2018. The Western District of Texas (San Antonio) was ranked 1st a year ago, while it was ranked 2nd five years ago. The district's position ten years ago was 2nd and 3rd twenty years ago.
The Southern District of Texas (Houston) ranked 2nd. The Southern District of Texas (Houston) was ranked 3rd a year ago, while it was ranked 1st five years ago. The district's position ten years ago was 1st and 4th twenty years ago.
The District of Arizona now ranks 3rd. The District of Arizona was ranked 2nd a year ago, while it was ranked 3rd five years ago. The district's position ten years ago was 3rd and 1st twenty years ago.
Compared to 10 years ago, Utah and Eastern District of Michigan (Detroit) now ranked in the top 10 did not appear in the top ten.
And compared to 20 years ago, Northern District of Texas (Fort Worth), Southern District of Florida (Miami) and Eastern District of Michigan (Detroit) were not sufficiently active to then make the top 10.
The federal judicial district which showed the greatest projected growth in immigration prosecutions compared to one year ago-80.2 percent-was New Mexico. Compared to five years ago, the district with the largest projected growth-48.9 percent-was Southern District of California (San Diego) .
In the last year, the judicial District Court recording the largest projected drop in immigration prosecutions-20.1 percent-was Utah.