Serious Criminal Immigration Convictions Still Infrequent Under Trump
The latest available data from the Justice Department show that during November 2017 the government reported 4,758 new immigration convictions. According to the case-by-case information analyzed by the Transactional Records Access Clearinghouse (TRAC) at Syracuse University, this number is down 5.3 percent over the previous month, but has largely recovered from the abnormally low numbers during the initial months of the Trump administration.
In addition, of these 4,758 convictions in November 2017, very few - only 576 or 12.1 percent - involved a prison term of one year or more. This would suggest that most of these convictions were for violations considered to be relatively minor.
In fact, focusing just on those convictions with a prison sentence of one year or more, the number in November 2017 is down 10.0 percent from the level of a year ago, and 41.1 percent below levels of five years ago.
Despite the call by Attorney General Sessions for increased prosecution of immigration offenses, as yet the number of criminal prosecutions and convictions have either been about the same or less than the numbers in past years[1].
A month-by-month comparison covering all convictions from January 2015 through November 2017 in the U.S. District and Magistrate Courts is shown below in Figure 1. These cover all convictions classified by federal prosecutors as "immigration" cases.
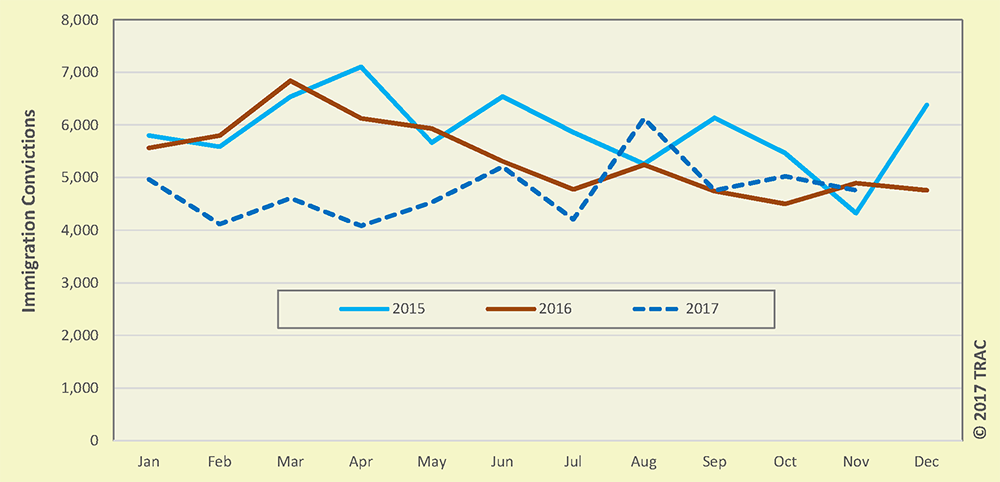
Figure 1. Criminal Convictions for Immigration Offenses, January 2015 - November 2017
(Click for larger image)
Immigration Arrests Versus Convictions
While Border Patrol arrests after President Trump assumed office initially fell, apprehensions started climbing again beginning in May 2017.[2] Criminal immigration convictions, as shown in Figure 1, were abnormally low during the initial months of the Trump administration reflecting in part these lower apprehension levels. When Border Patrol arrests began climbing, so too did the number of criminal prosecutions.
Throughout this period, however, criminal prosecution and conviction for immigration offenses involved only a small minority of the individuals arrested by CBP and ICE.
Calculating how small this minority of arrested individuals who were ultimately criminally prosecuted and convicted presents many challenges. Reliable data are not available, for example, on precisely how many ICE arrests involve individuals who committed criminal violations of the law—illegal entry for example, rather than simply overstaying their visa. Available data does suggest that the criminal offenses of illegal entry and illegal re-entry were involved in most DHS arrests since Border Patrol arrests dominate overall arrest totals.
| Immigration Arrests | |
| CBP Border Patrol | 310,531 |
| ICE Enforcement and Removal Operations | 143,470 |
| ICE Homeland Security Investigations | 32,958 |
| Total Arrests | 486,959 |
| Immigration Criminal Convictions | |
| Sentenced 1 year or more | 8,208 |
| All convictions | 56,766 |
| Percent of Immigration Arrests | |
| Sentenced 1 year or more | 1.7% |
| All convictions | 11.7% |
Using available information, the odds of criminal convictions for immigration violations appears to be somewhere between one out of every seven to one out of every ten of those arrested by CBP and ICE during 2017. This range is naturally a rough approximation.[3] This approximation uses the fact that there were a total of 486,959 apprehensions reported by the Border Patrol and by Immigration and Customs Enforcement (ICE) during FY 2017. In comparison, case-by-case government records indicate there were just 56,766 criminal convictions for immigration matters - or only 11.7 percent of the total number of arrests.
During this same period there were 8,208 immigration convictions with sentences of one year or more which represent only 1.7 percent of total arrests. See Table 1.
Top Charges for Immigration Convictions
Convictions last November for one of two offenses account for 97 percent of all immigration convictions involving a prison term of at least one year. The largest component - 77 percent - was for illegal re-entry under Title 8 Section 1326 of the United States Code. An additional one in five (20 percent) were brought under Title 8 Section 1324 of the United State Code and involved illegally bringing in or illegally harboring immigrants. These have been the dominant first and second most frequent felony convictions for many years.
The remaining 3 percent of felony convictions that result in prison sentences of at least a year are made up of a diverse array of offenses often involving use of fraudulent ID documents under various statutory provisions of Title 18 of the United States Code.
Top Ranked Judicial Districts
Not surprisingly the five federal judicial districts along the country's southwest border with Mexico account for the lion's share of criminal immigration convictions. The Southern District of Texas (Houston) led the country in the largest number of immigration convictions in November 2017 involving prison terms of at least a year. This district has been fairly consistently ranked in the top spot for past periods as well.
The Western District of Texas (San Antonio) had the second largest number of immigration convictions in November, followed by the Southern District of California (San Diego). See Table 2 for the other districts in the top ten.
| Judicial District | Count | Rank | 1yr ago | 5yrs ago |
|---|---|---|---|---|
| Texas, S | 222 | 1 | 1 | 1 |
| Texas, W | 114 | 2 | 2 | 3 |
| Cal, S | 52 | 3 | 4 | 4 |
| Arizona | 37 | 4 | 3 | 2 |
| N Mexico | 22 | 5 | 5 | 7 |
| Texas, N | 13 | 6 | 6 | 8 |
| Utah | 11 | 7 | 16 | 12 |
| Cal, C | 9 | 8 | 13 | 5 |
| Fla, M | 7 | 9 | 11 | 14 |
| Puer Rico | 7 | 9 | 25 | 30 |
The line-up, however, differs somewhat if all immigration convictions are included, rather than just those involving a prison sentence of at least one year. This is because, as TRAC has reported earlier, districts vary in their charging and settlement practices in the immigration area. Federal prosecutor policies are central here since most convictions are the result of plea agreements.
The sharpest contrast is between Arizona and the Southern District of Texas. Federal prosecutors in Arizona chalk up a large number of immigration convictions, but only a small proportion involve convictions on serious felonies for which a prison term of one year or more is assigned. In November 2017 in Arizona, for example, only 3 percent of its immigration convictions were considered serious enough to require prison time of at least a year. While in the Southern District of Texas fully 25 percent of its immigration convictions involved at least that length of a prison sentence.
Thus, when all immigration convictions are considered, the line-up shifts. The Western District of Texas moves into first place with 1,231 immigration convictions during November 2017, followed by Arizona with 1,066, with the Southern District of Texas in third place with 872 immigration convictions.
Footnotes
[1] Also see TRAC's December 2017 report, "Criminal Immigration Prosecutions Down 14% in FY 2017".
[2] See United States Border Patrol Total Illegal Alien Apprehensions FY2000 - FY2017.
[3] There are a number of other limitations to this estimate. For example, it does not include arrests by CBP personnel other than by the Border Patrol. In addition, Homeland Security Investigations agents at ICE may pursue violations of the law that are broader than simply immigration matters, so some of its resulting criminal convictions may not be captured in these conviction counts. And, as mentioned, it includes ICE ERO arrests for non-criminal violations that should properly be excluded.