Asylum Representation Rates Have Fallen Amid Rising Denial Rates
Very recent Immigration Court records reveal that during FY 2017 asylum decisions were up sharply. A total of 30,179 cases were decided by judges last year, a marked increase from 22,312 cases in FY 2016. This is the largest number of asylum cases decided in any one year since FY 2005. While asylum grants increased, denials grew even faster. This pushed the percent who were denied asylum to 61.8 percent. This is the fifth year in a row that denial rates have risen. Five years ago the denial rate was just 44.5 percent. See Figure 1.
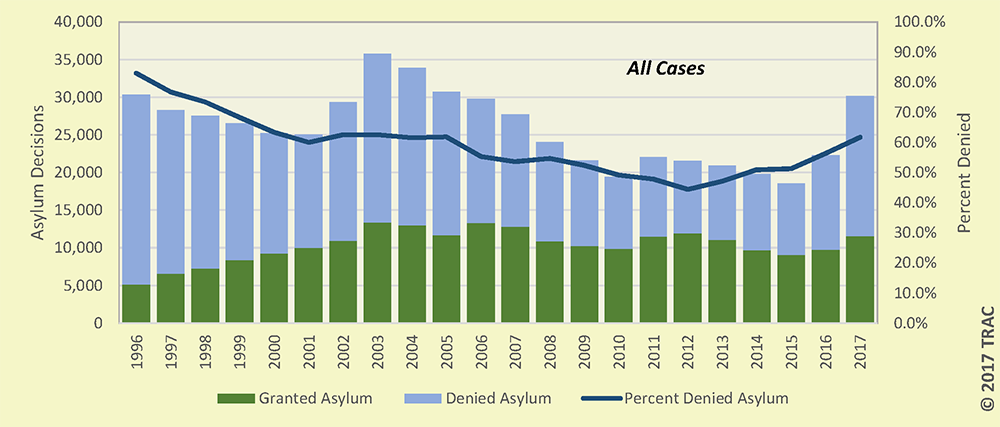
Figure 1. Immigration Court Asylum Decisions: All Cases
(Click for larger image)
This report is the second in a two-part series examining this recent data. The first report looked at how asylum outcome increasingly depended on the judge assigned the case. This report analyzes national trends in the number of asylum decisions, and how outcomes differ by nationality and whether asylum seekers were represented[1]. In addition, TRAC has released individual reports on each of 293 immigration judges that compare the asylum decisions each rendered between FY 2012-FY 2017.
These latest Immigration Court numbers are based on case-by-case records obtained through a series of Freedom of Information Act (FOIA) requests by the Transactional Records Access Clearinghouse (TRAC) at Syracuse University.
More Unrepresented Among Asylum Seekers
The proportion of asylum seekers who are unable to obtain representation has risen markedly. Ten years ago during FY 2007, only 13.6 percent were unrepresented. Five years ago (FY 2012), 15.8 percent were unrepresented. In FY 2017 the unrepresented figure was 20.6 percent. However, the proportion was even higher during FY 2014 when asylum seekers without attorneys suddenly jumped to 23.2 percent. Since then the rate has slowly subsided. However, the proportion of asylum seekers who were unrepresented last year remained significantly higher than levels prior to the 2014 jump. See Figure 2.
These figures reflect in part the inadequacy of the supply of attorneys to keep up with increases in demand which occurred over this period[2]. Recent efforts to increase the availability of attorneys through ramped up pro bono efforts and government-funded programs have sought to increase this supply. However, given the court's backlog, it may take some time before these newly represented cases are decided and the full impact of these programs will be felt.
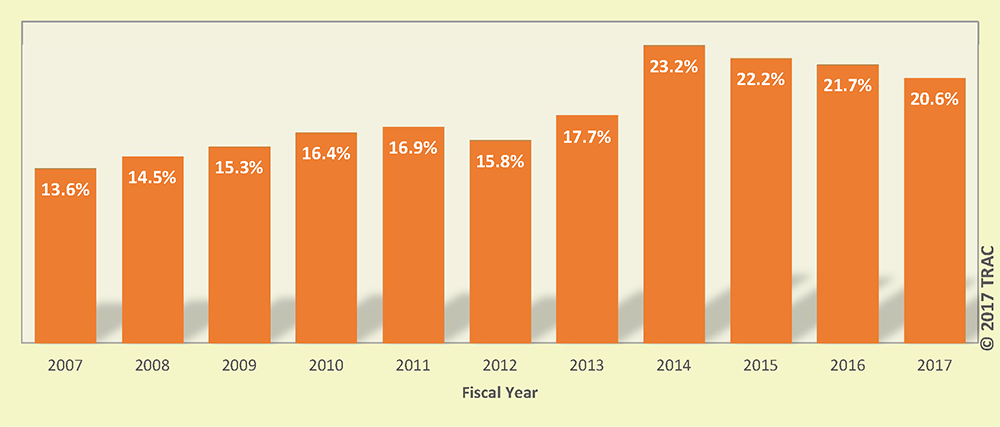
Figure 2. Percent of Decided Asylum Cases Without Representation
(Click for larger image)
Odds of Gaining Asylum Five Times Higher When Represented
Without representation, the deck is stacked against an asylum seeker. Statistically, only one out of every ten win their case. With representation, nearly half are successful. Figure 3 shows trends in asylum denial rates over the past two decades when just decisions in represented cases are examined.
The number of decisions in represented cases also increased in FY 2017. However, denials again grew faster. This has resulted in a similar rise in denial rates over the past five years as shown earlier in Figure 1, even though only cases with representation are graphed in Figure 3. Detailed statistics for both represented and for unrepresented cases are given in Table 1 at the end of this report.
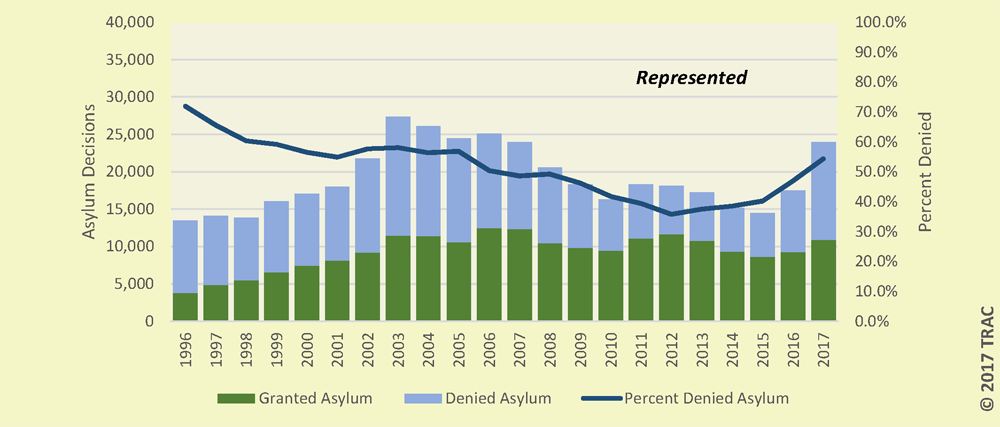
Figure 3. Immigration Court Asylum Decisions: Cases with Representation
(Click for larger image)
Asylum Seekers Success Varies Markedly by Nationality
China had the largest number of asylum seekers. During the last six years, 31,176 decisions involved asylum seekers from China. Far behind China but in second place was El Salvador with half the number (15,667). Mexico was close behind El Salvador in the number of asylum decisions (14,688), followed by Honduras (11,020) and Guatemala (10,983).
There was also wide variation in asylum grant and denial rates depending upon the nationality of the asylum seeker. Focusing first on just the ten nationalities that had the largest number of Immigration Court asylum cases decided during FY 2012 - FY 2017, Mexico had the highest denial rate with almost nine out of ten (88.0%) turned down. See Figure 4. The three Central American countries that each have had large numbers arriving at U.S. borders seeking asylum also had very high denial rates: El Salvador (79.2%), Honduras (78.1%), and Guatemala (74.7%).
Asylum seekers from Ethiopia were the most successful among the top ten nationalities with denial rates of only 17.0 percent. China was in second place with its 20.3 percent denial rate, followed by Nepal with just one quarter denied (25.1%).
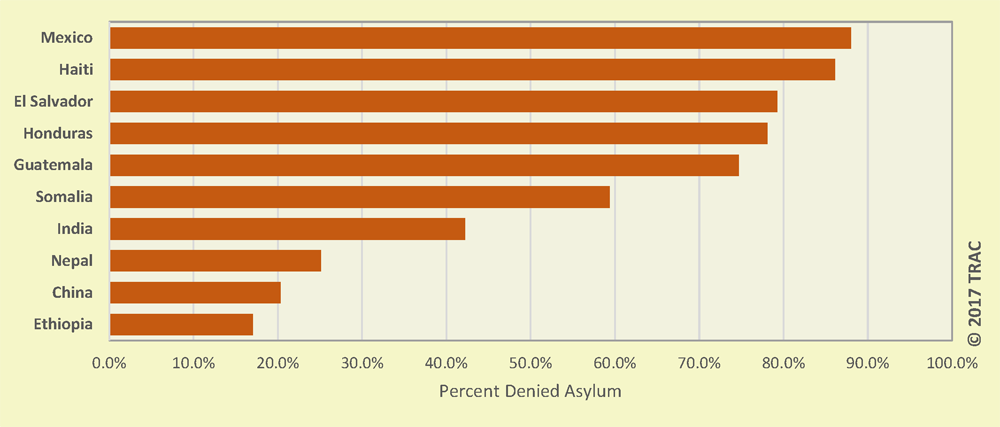
Figure 4. Asylum Denial Rates by Nationality, FY 2012 - FY 2017
(Click for larger image)
Expanding the comparisons to all countries that had at least 25 asylum seekers with cases decided during FY 2012 - FY 2017, Jamaica had the highest denial rate (91.4%), followed closely by Laos (89.9%), the Philippines, (89.7%) and Mexico (88.0%).
At the other extreme, the Soviet Union had the lowest denial rate (9.5%), with Byelorussia and Egypt with almost as low denial rates at 11.1 percent each.
Outcomes by Nationality and Representation Status
Regardless of nationality, representation status still made a big difference between whether asylum was granted or denied. Focusing again on just the ten countries with the largest number of cases decided, Figure 5 contrasts the denial rates for asylum decisions in which the asylum seekers did or didn't have an attorney to represent them. While having an attorney did not guarantee success, denial rates for those without an attorney were uniformly high. Indeed, for the majority of countries nationality had little impact for the unrepresented.
Unrepresented asylum seekers from three countries shown in Figure 4 — Somalia, China, and Ethiopia — had lower rates of denial than might otherwise be expected, and distinctly lower than those that were unrepresented from the other seven countries. An asylum seeker is counted as unrepresented in the court's data if an attorney hasn't formally entered an appearance in the case. While data are unavailable on other forms of assistance, it is possible that asylum seekers from different countries may also differ in their access to informal networks that provide helpful advice even when they aren't officially represented.
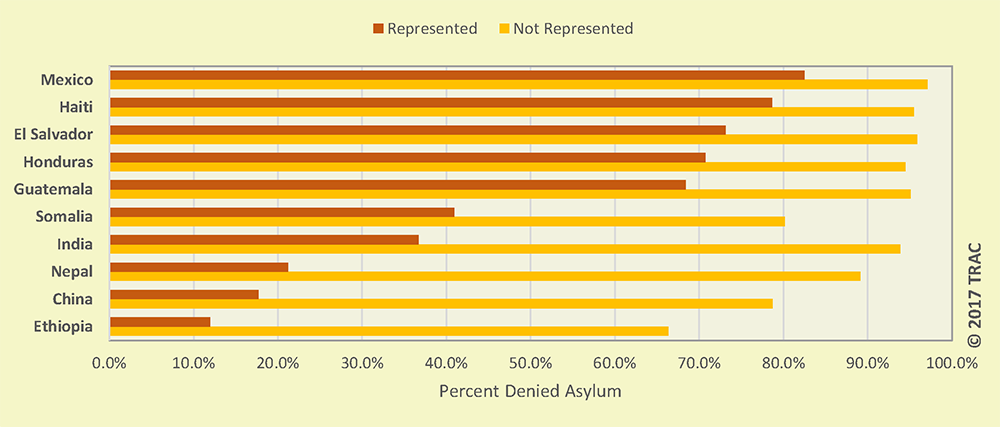
Figure 5. Asylum Denial Rates by Nationality and Representation Status, FY 2012 - FY 2017
(Click for larger image)
The number of asylum decisions, and their outcome by representation status, are shown below in Table 2 for all countries that had at least 25 asylum seekers with cases decided during FY 2012 - FY 2017.
Footnotes
[1] These cover asylum decisions decided by immigration judges. While there are a large number of cases involving unaccompanied children before immigration judges, the actual decisions on whether to grant asylum or other relief is often decided by other parties. Where this happens, such asylum decisions are not part of the data examined here.
[2] Even though these figures do not include many cases involving unaccompanied children since decisions to provide relief are usually rendered by other bodies [see note above], evidence shows that the surging number of such children along with mothers with children seeking refuge in this country exceeded the availability of attorneys willing and able to take their cases. See, for example, November 2014 TRAC report.
| Fiscal Year | Number of Asylum Decisions | Percent Denied Asylum | ||||
| All | Not Represented |
Represented | All | Not Represented |
Represented | |
| 1996 | 30,342 | 16,909 | 13,433 | 83.0% | 91.9% | 71.9% |
| 1997 | 28,307 | 14,222 | 14,085 | 76.8% | 87.9% | 65.5% |
| 1998 | 27,521 | 13,644 | 13,877 | 73.4% | 86.8% | 60.3% |
| 1999 | 26,578 | 10,556 | 16,022 | 68.3% | 82.2% | 59.2% |
| 2000 | 25,265 | 8,225 | 17,040 | 63.5% | 77.8% | 56.5% |
| 2001 | 25,036 | 7,025 | 18,011 | 60.0% | 73.2% | 54.9% |
| 2002 | 29,357 | 7,579 | 21,778 | 62.6% | 76.7% | 57.7% |
| 2003 | 35,782 | 8,447 | 27,335 | 62.6% | 77.2% | 58.1% |
| 2004 | 33,896 | 7,786 | 26,110 | 61.6% | 78.9% | 56.4% |
| 2005 | 30,743 | 6,289 | 24,454 | 61.9% | 81.6% | 56.8% |
| 2006 | 29,780 | 4,683 | 25,097 | 55.3% | 81.8% | 50.4% |
| 2007 | 27,733 | 3,767 | 23,966 | 53.7% | 85.6% | 48.6% |
| 2008 | 24,067 | 3,501 | 20,566 | 54.8% | 87.1% | 49.3% |
| 2009 | 21,604 | 3,310 | 18,294 | 52.5% | 87.1% | 46.2% |
| 2010 | 19,450 | 3,190 | 16,260 | 49.2% | 87.0% | 41.8% |
| 2011 | 22,045 | 3,716 | 18,329 | 47.9% | 89.8% | 39.4% |
| 2012 | 21,536 | 3,403 | 18,133 | 44.5% | 90.6% | 35.8% |
| 2013 | 20,947 | 3,713 | 17,234 | 47.2% | 92.2% | 37.5% |
| 2014 | 19,779 | 4,585 | 15,194 | 51.0% | 92.5% | 38.5% |
| 2015 | 18,592 | 4,124 | 14,468 | 51.4% | 90.4% | 40.3% |
| 2016 | 22,312 | 4,843 | 17,469 | 56.5% | 90.5% | 47.0% |
| 2017 | 30,179 | 6,228 | 23,951 | 61.8% | 90.0% | 54.4% |
(click title to open in a new window)
| Nationality | Number of Asylum Decisions | Percent Denied Asylum | ||||
| All | Not Represented |
Represented | All | Not Represented |
Represented | |
| China | 31,176 | 1,328 | 29,848 | 20.3% | 78.7% | 17.7% |
| El Salvador | 15,667 | 4,210 | 11,457 | 79.2% | 95.9% | 73.1% |
| Mexico | 14,688 | 5,550 | 9,138 | 88.0% | 97.1% | 82.5% |
| Honduras | 11,020 | 3,407 | 7,613 | 78.1% | 94.5% | 70.7% |
| Guatemala | 10,983 | 2,575 | 8,408 | 74.7% | 95.1% | 68.4% |
| India | 3,890 | 376 | 3,514 | 42.2% | 93.9% | 36.7% |
| Nepal | 2,722 | 156 | 2,566 | 25.1% | 89.1% | 21.2% |
| Haiti | 2,602 | 1,156 | 1,446 | 86.1% | 95.5% | 78.6% |
| Ethiopia | 2,284 | 214 | 2,070 | 17.0% | 66.4% | 11.9% |
| Somalia | 1,873 | 881 | 992 | 59.4% | 80.1% | 40.9% |
| Eritrea | 1,822 | 279 | 1,543 | 25.4% | 71.0% | 17.1% |
| Egypt | 1,566 | 126 | 1,440 | 11.1% | 52.4% | 7.5% |
| Cameroon | 1,273 | 194 | 1,079 | 26.7% | 51.5% | 22.2% |
| Soviet Union | 1,215 | 62 | 1,153 | 9.5% | 58.1% | 6.9% |
| Russia | 1,136 | 134 | 1,002 | 29.8% | 79.1% | 23.2% |
| Bangladesh | 1,135 | 167 | 968 | 51.5% | 89.8% | 44.9% |
| Pakistan | 1,126 | 131 | 995 | 36.6% | 72.5% | 31.9% |
| Colombia | 1,067 | 205 | 862 | 58.6% | 87.8% | 51.6% |
| Guinea | 946 | 216 | 730 | 40.8% | 69.4% | 32.3% |
| Venezuela | 914 | 127 | 787 | 49.8% | 79.5% | 45.0% |
| Nigeria | 853 | 276 | 577 | 58.1% | 83.3% | 46.1% |
| Albania | 834 | 49 | 785 | 27.3% | 79.6% | 24.1% |
| Ecuador | 774 | 140 | 634 | 69.0% | 90.7% | 64.2% |
| Ghana | 736 | 476 | 260 | 70.8% | 80.5% | 53.1% |
| Indonesia | 724 | 65 | 659 | 50.0% | 84.6% | 46.6% |
| Iraq | 662 | 113 | 549 | 39.7% | 85.8% | 30.2% |
| Sri Lanka | 630 | 57 | 573 | 29.0% | 84.2% | 23.6% |
| Jamaica | 627 | 301 | 326 | 91.4% | 96.7% | 86.5% |
| Nicaragua | 620 | 237 | 383 | 78.7% | 93.7% | 69.5% |
| Syria | 612 | 54 | 558 | 18.5% | 72.2% | 13.3% |
| Ukraine | 610 | 113 | 497 | 41.5% | 84.1% | 31.8% |
| Iran | 602 | 104 | 498 | 32.1% | 66.3% | 24.9% |
| Gambia | 581 | 90 | 491 | 33.7% | 85.6% | 24.2% |
| Cuba | 563 | 367 | 196 | 81.7% | 84.2% | 77.0% |
| Armenia | 543 | 65 | 478 | 38.5% | 81.5% | 32.6% |
| Kenya | 543 | 131 | 412 | 55.2% | 90.8% | 43.9% |
| Mali | 509 | 49 | 460 | 32.0% | 87.8% | 26.1% |
| Moldavia (Moldova) | 508 | 44 | 464 | 28.3% | 79.5% | 23.5% |
| Burkina Faso | 497 | 54 | 443 | 21.5% | 74.1% | 15.1% |
| Ivory Coast (Cote D'ivoire) | 475 | 53 | 422 | 40.6% | 88.7% | 34.6% |
| Dominican Republic | 425 | 177 | 248 | 87.1% | 97.2% | 79.8% |
| Peru | 379 | 76 | 303 | 69.4% | 98.7% | 62.0% |
| Romania | 377 | 44 | 333 | 51.5% | 81.8% | 47.4% |
| Brazil | 337 | 75 | 262 | 76.0% | 96.0% | 70.2% |
| Senegal | 337 | 132 | 205 | 60.5% | 89.4% | 42.0% |
| Uzebekistan | 337 | 36 | 301 | 31.2% | 86.1% | 24.6% |
| Kirghizia (Kyrgyzstan) | 330 | 24 | 306 | 23.9% | 75.0% | 19.9% |
| Mauritania | 327 | 36 | 291 | 39.4% | 94.4% | 32.6% |
| Sudan | 318 | 102 | 216 | 44.0% | 90.2% | 22.2% |
| Congo | 316 | 56 | 260 | 33.2% | 73.2% | 24.6% |
| Mongolia | 314 | 42 | 272 | 53.2% | 92.9% | 47.1% |
| Name A Country | 293 | 22 | 271 | 19.5% | 63.6% | 15.9% |
| Burma (Myanmar) | 282 | 34 | 248 | 32.6% | 85.3% | 25.4% |
| Belarus | 243 | 22 | 221 | 17.7% | 63.6% | 13.1% |
| Sierra Leone | 238 | 57 | 181 | 55.5% | 82.5% | 47.0% |
| Democratic Republic of Congo | 236 | 66 | 170 | 45.3% | 78.8% | 32.4% |
| Yugoslavia | 236 | 12 | 224 | 18.6% | 91.7% | 14.7% |
| Rwanda | 231 | 32 | 199 | 25.1% | 59.4% | 19.6% |
| Afghanistan | 224 | 48 | 176 | 37.5% | 66.7% | 29.5% |
| Philippines | 224 | 83 | 141 | 89.7% | 98.8% | 84.4% |
| Liberia | 217 | 86 | 131 | 62.2% | 93.0% | 42.0% |
| Kosovo | 210 | 11 | 199 | 18.6% | 63.6% | 16.1% |
| Kazakhstan | 207 | 21 | 186 | 25.1% | 61.9% | 21.0% |
| Burundi | 202 | 29 | 173 | 31.2% | 82.8% | 22.5% |
| Zimbabwe | 192 | 33 | 159 | 46.9% | 87.9% | 38.4% |
| Uganda | 190 | 23 | 167 | 29.5% | 82.6% | 22.2% |
| Vietnam | 172 | 77 | 95 | 84.9% | 97.4% | 74.7% |
| Togo | 162 | 30 | 132 | 48.8% | 93.3% | 38.6% |
| Jordan | 151 | 34 | 117 | 63.6% | 94.1% | 54.7% |
| Turkey | 149 | 24 | 125 | 56.4% | 70.8% | 53.6% |
| Lebanon | 147 | 20 | 127 | 57.8% | 65.0% | 56.7% |
| Yemen | 145 | 22 | 123 | 46.2% | 95.5% | 37.4% |
| Byelorussia (Belarus) | 144 | 2 | 142 | 11.1% | 100.0% | 9.9% |
| Georgia | 124 | 15 | 109 | 35.5% | 80.0% | 29.4% |
| Bulgaria | 99 | 15 | 84 | 44.4% | 60.0% | 41.7% |
| Guyana | 99 | 40 | 59 | 78.8% | 90.0% | 71.2% |
| Tajikistan (Tadzhik) | 97 | 5 | 92 | 38.1% | 80.0% | 35.9% |
| Belize | 91 | 44 | 47 | 82.4% | 97.7% | 68.1% |
| Bosnia-Herzegovina | 91 | 35 | 56 | 82.4% | 94.3% | 75.0% |
| Laos | 89 | 57 | 32 | 89.9% | 98.2% | 75.0% |
| Azerbaijan | 84 | 7 | 77 | 21.4% | 100.0% | 14.3% |
| Trinidad and Tobago | 84 | 29 | 55 | 78.6% | 93.1% | 70.9% |
| Angola | 83 | 30 | 53 | 67.5% | 96.7% | 50.9% |
| Niger | 83 | 23 | 60 | 63.9% | 91.3% | 53.3% |
| South Korea | 76 | 20 | 56 | 85.5% | 100.0% | 80.4% |
| Tanzania | 73 | 19 | 54 | 57.5% | 84.2% | 48.1% |
| Chad | 71 | 7 | 64 | 19.7% | 42.9% | 17.2% |
| Fiji | 70 | 21 | 49 | 67.1% | 100.0% | 53.1% |
| Germany | 69 | 32 | 37 | 85.5% | 96.9% | 75.7% |
| Bolivia | 68 | 14 | 54 | 69.1% | 92.9% | 63.0% |
| Benin | 67 | 8 | 59 | 43.3% | 100.0% | 35.6% |
| Cambodia | 67 | 22 | 45 | 71.6% | 100.0% | 57.8% |
| Saudi Arabia | 66 | 6 | 60 | 30.3% | 66.7% | 26.7% |
| Israel | 65 | 19 | 46 | 73.8% | 94.7% | 65.2% |
| Serbia Montenegro | 60 | 11 | 49 | 46.7% | 100.0% | 34.7% |
| Hungary | 59 | 22 | 37 | 74.6% | 95.5% | 62.2% |
| Djibouti | 54 | 4 | 50 | 20.4% | 100.0% | 14.0% |
| Central African Republic | 53 | 8 | 45 | 28.3% | 62.5% | 22.2% |
| Morocco | 53 | 16 | 37 | 64.2% | 81.3% | 56.8% |
| Macedonia | 51 | 7 | 44 | 49.0% | 100.0% | 40.9% |
| Thailand | 51 | 22 | 29 | 84.3% | 100.0% | 72.4% |
| Bahamas | 44 | 25 | 19 | 81.8% | 96.0% | 63.2% |
| South Africa | 44 | 10 | 34 | 70.5% | 100.0% | 61.8% |
| Algeria | 41 | 6 | 35 | 63.4% | 100.0% | 57.1% |
| Chile | 41 | 10 | 31 | 85.4% | 80.0% | 87.1% |
| Canada | 40 | 13 | 27 | 65.0% | 100.0% | 48.1% |
| Argentina | 39 | 10 | 29 | 64.1% | 90.0% | 55.2% |
| Poland | 39 | 16 | 23 | 87.2% | 100.0% | 78.3% |
| Malaysia | 38 | 9 | 29 | 50.0% | 88.9% | 37.9% |
| Turkmenistan | 37 | 5 | 32 | 29.7% | 100.0% | 18.8% |
| United Kingdom | 37 | 11 | 26 | 70.3% | 100.0% | 57.7% |
| Lithuania | 36 | 11 | 25 | 77.8% | 100.0% | 68.0% |
| Libya | 36 | 7 | 29 | 41.7% | 71.4% | 34.5% |
| Costa Rica | 35 | 12 | 23 | 80.0% | 100.0% | 69.6% |
| Greece | 33 | 5 | 28 | 45.5% | 60.0% | 42.9% |
| Palestine | 31 | 7 | 24 | 58.1% | 57.1% | 58.3% |
| Bhutan | 28 | 5 | 23 | 42.9% | 80.0% | 34.8% |
| Italy | 28 | 6 | 22 | 75.0% | 100.0% | 68.2% |
| Spain | 28 | 7 | 21 | 75.0% | 71.4% | 76.2% |
| Zambia | 28 | 10 | 18 | 67.9% | 80.0% | 61.1% |
| Panama | 26 | 13 | 13 | 76.9% | 84.6% | 69.2% |
| Kuwait | 25 | 1 | 24 | 32.0% | 0.0% | 33.3% |