Who is Represented in Immigration Court?
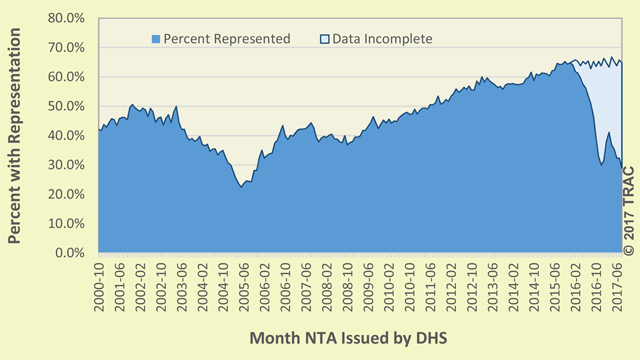
The odds of obtaining representation for immigrants appearing in Immigration Court has varied over the years. At the end of the Clinton Administration about 45 percent of individuals in Immigration Court cases were represented. This rose to almost 50 percent in the beginning months of the Bush Administration, before then plummeting to around 25 percent in 2005. Thereafter, the representation rate started a fairly steady climb. It surpassed 60 percent after 2014 and continued rising to 65 percent by the end of 2015.[1] See Figure 1.
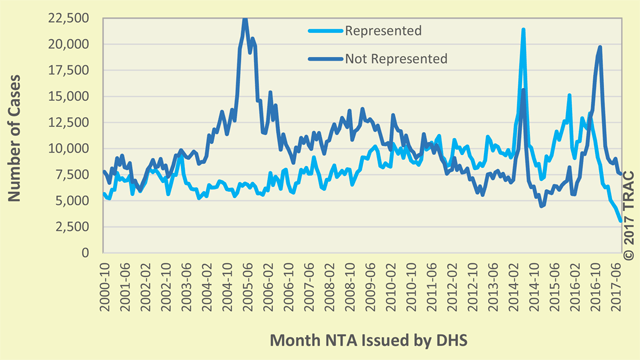
However, the observed rise in representation rates did not necessarily mean that the number of immigrants who had representation rose. See Figure 2. While monthly figures gyrate up and down, when these natural monthly fluctuations are smoothed out the number of cases with representation rose only modestly during the 2000 - 2013 period.
Only beginning in 2014 do we see a sharp increase in represented cases. This occurred at the time a large surge in unaccompanied children, as well as women with children, seeking refuge in this country arrived from El Salvador, Guatemala and Honduras. At that time concerted efforts were mounted to recruit attorneys to assist them. Since the 2014 surge, representation numbers initially fell and then rose. The declining number of represented cases during 2016-2017 in large part may reflect delays in attorneys entering their appearance. Given the badly backlogged court system, there are often long delays before hearings are even scheduled in a case.
In contrast to the fairly stable numbers of represented cases up until 2014, the flow of new Immigration Court cases over this same period has been anything but steady. With only modest changes in the number of represented cases, the number of unrepresented persons expanded and contracted to reflect these changing workload numbers. As shown in Figure 2, a huge spike in arriving cases during 2005 resulted in a large jump in unrepresented numbers, driving representation rates sharply down. Likewise, declining numbers of new NTAs arriving between 2009 through 2013 resulted in a decline in the number of unrepresented cases. Computed representation rates rose as a result.
Who Is Represented? New TRAC Data Provides Answers

Within these overall national totals, many other factors impact the odds that an individual can obtain representation. Using very recent case-by-case court records, the Transactional Records Access Clearinghouse (TRAC) at Syracuse University has just completed a detailed analysis examining how the odds of representation varies with the particular court and hearing location, the nationality and custody status of the immigrant, and the length of time the person has been in the U.S. Cases are followed so the ultimate outcome of each case can be linked to whether the individual was represented or not.
A new interactive free web-tool provides access to these detailed statistics TRAC has compiled on each of these factors. It joins another tool TRAC recently developed that allows anyone to look up relevant statistics on representation by a person's address. This earlier companion tool provides much greater geographic detail than our latest tool, revealing how variable representation rates are within the same state depending upon the particular county and community in which individuals reside.[2]
The new tool in contrast focuses across time to show how representation rates change by many other characteristics of the case. A few highlights from these findings are presented below documenting the influence of detention status and nationality.
A. Representation and Detention Status
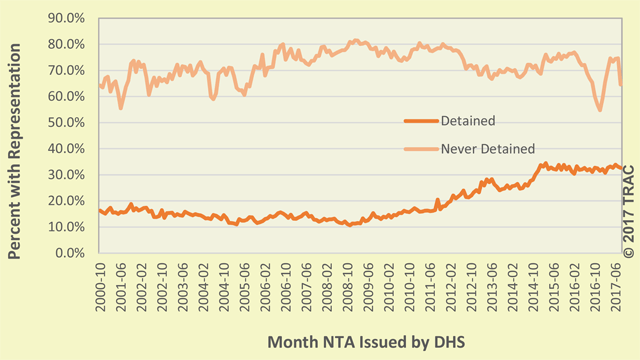
Although it has long been known that few individuals who are detained find attorneys to represent them, these differences are dramatically shown in Figure 3 where representation rates are separating plotted for those who are detained as compared with individuals who were never detained.[3]
As shown in Figure 3, representation rates separated by detention status are also much more stable than the pattern seen earlier in Figure 1 for overall representation rates. Representation rates for detained individuals have ranged between roughly 10 and 30 percent, and after falling from 2000 - 2005, stabilized for several years before they began to steadily improve from 2009 onward, leveling out during 2015 - 2017 at slightly about 30 percent.
Representation rates for those who were never detained in contrast have generally ranged between 60 and 80 percent. In contrast to those for detained individuals, representation rates initially rose, rather than fell. And then after stabilizing around 80 percent, rates fell to around 70 percent during the 2012 - 2014 period.
Note the unusual pattern for the 2016 - 2017 period may be an artifact of incomplete information. Cases for non-detained individuals are particularly backlogged in Immigration Court, and attorneys may not have entered an appearance yet.
B. Nationality and Representation
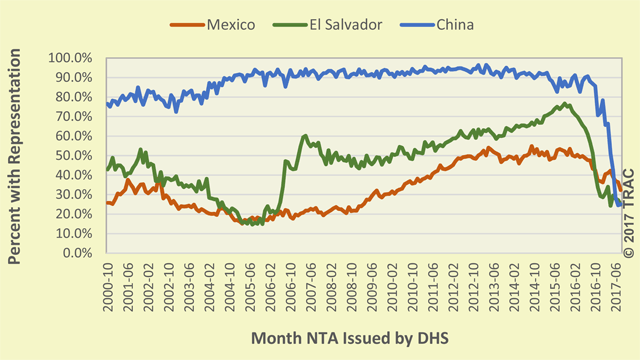
The nationality of an individual is also associated with the odds individuals obtain representation. This may reflect in part the tendency for specific nationalities to be concentrated in different parts of the country, their available financial resources, and different levels of community support available to assist them. To illustrate this, representation rates for the 2000 - 2017 period are shown in Figure 4 for three separate nationalities: Mexico, El Salvador, and China.
Individuals from Mexico had the lowest representation rates, while those from China had the highest. Representation rates for individuals from China rose from 75 percent to over 90 percent where they stabilized for most of the period. Much of the drop off in 2016-2017 for all three trend lines are again because many attorneys may not have entered an appearance yet in a significant number of backlogged cases still waiting to be heard by an immigration judge.
Not only are representation rates for Mexicans lower, but their pattern across the years is quite different from cases involving individuals from China. For the early years, Mexican representation rates fell from 30 percent down to 20 percent and then started a steady rise for most of the period until they reached 50 percent where they have stayed.
Generally representation rates for individuals from El Salvador were somewhat higher than for Mexicans, with an unusual jump from 20 percent up to 60 percent in representation rates that occurred between 2006 - 2007.
Of course, the odds for any individual reflect the composite of these factors. Thus, the rise in representation rates for Mexicans reflects in part the declining proportion of individuals being detained during this period.
Footnotes
[1] The substantial drop off in representation rates shown for recent months is artificial; it simply reflects incomplete information on representation status since some attorneys have yet to enter their eventual appearance in many cases.
To avoid the potential confounding effects of representation itself on the calculated statistic, representation rates are calculated on the number of cases, rather than proceedings. Comparisons are also based upon when cases began, rather than concluded, for similar reasons.
A significant upward bias is introduced if cases with multiple proceedings are allowed to count more than cases with single proceedings since those who are represented tend to have more proceedings. When the government switched from using proceeding to case counts, reported representation rates fell by around 10 percentage points. (For example, EOIR's published representation rates dropped from 45% to 35% for FY 2009, from 50% to 40% in FY 2010, from 53% to 43% in FY 2011 and from 56% to 50% in FY 2012. See Figure 10 in EOIR's FY 2013 versus earlier annual statistical reports.)
Basing calculations on cases that completed at the same time rather than originated at the same time also introduces another source of bias. This is because representation itself has a substantial impact on how long a case takes to complete. This bias can be quite significant during periods where the incoming volume of cases is rapidly changing. For example, a bulge in cases will move through the court at a different pace for unrepresented versus represented cases producing an early surge in unrepresented case closures which is not offset by the actual numbers of represented cases since these cases may be still ongoing.
When a case began in this analysis uses the date the Notice to Appear (NTA) was issued by Homeland Security officials. This allows a clear separation between deportation actions initiated under President Trump as compared with those taken under previous presidential administrations.
[2] The development of these new tools was supported under a grant from the Carnegie Corporation of New York, supplemented by gifts from individual donors and a small grant from the Vera Institute of Justice. Their support is gratefully acknowledged.
[3] There are a smaller number of cases where the individual was initially detained but then released that are not included in Figure 3. Obtaining release is itself often related to whether an individual has an attorney. Here detention status can be said to be highly influenced by having an attorney in the first place, rather than detention status driving representation rates.