Federal Criminal Prosecutions Referred by DHS Continue to Fall
The latest available data from the Justice Department show that during April 2017 the government reported 4,434 new criminal prosecutions as a result of referrals by the immigration and customs components in the Department of Homeland Security. According to the case-by-case information analyzed by the Transactional Records Access Clearinghouse (TRAC), this number is down 17.5 percent over the previous month and down 42.9 percent from a year ago in April 2016. See Table 1.
Immigration and Customs Components of DHS
| Number April 2017 | 4,434 |
| Percent Change from previous month | -17.5 |
| Percent Change from April 2016 | -42.9 |
| Number December 2012 (peak) | 10,708 |
| Percent Change from Peak | -58.6 |
The number of prosecutions include those referred by Customs and Border Protection, Immigration and Customs Enforcement, U.S. Citizenship and Immigration Services, and joint task forces of DHS with state and local authorities. The long term trends, along with the month-to-month variation driven largely by seasonality in apprehensions along the southwest border, is shown more clearly in Figure 1.
Since the latest data track prosecutions through April 2017 they do not as yet reflect the impact of the new priorities Attorney General Jeff Sessions promulgated in his April 11, 2017 memorandum to federal prosecutors calling for stepped up use of criminal sanctions in the immigration area.
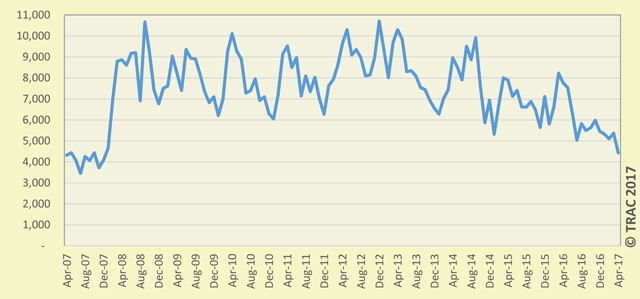
Figure 1. Criminal Prosecutions Referred by Immigration and Customs Components of DHS,
April 2007 - April 2017
Between March 2008 and October 2014, criminal prosecutions were at their high water mark, reaching above 10,000 in some months. In November 2014, prosecutions fell below 6,000 for the first time since January 2008. Over the past 12 months, the number of DHS referred prosecutions have been falling fairly rapidly.
A year ago in April 2016 DHS referred prosecutions accounted for almost two out of every three federal prosecutions nationwide (64.4%). This past April, a year later, they had fallen to roughly half of federal criminal prosecutions (50.5%). Since DHS also enforces customs and related criminal statutes, the portion in April 2017 that represented strictly immigration offenses had fallen well below half to roughly four out of every ten (41.6%) federal prosecutions.
The comparisons of the number of defendants charged are based on case-by-case information obtained by TRAC under the Freedom of Information Act from the Executive Office for United States Attorneys. Where a prosecution was initially filed in U.S. Magistrate Court and then transferred to the U.S. District Court, the magistrate filing date was used since this provides an earlier indicator of actual trends.
Prosecutions in U.S. Magistrate Courts
Top Ranked Lead Charges
In April 2017, 3,362 defendants in cases for these matters were filed in U.S. Magistrate Courts. These courts handle less serious misdemeanor cases, including what are called "petty offenses." In addition, complaints are sometimes filed in the magistrate courts before an indictment or information is entered. In these cases, the matter starts in the magistrate court and later moves to the district court where subsequent proceedings take place.
In the magistrate courts in April the most frequently cited lead charge was Title 8 U.S.C Section 1325 involving "Entry of alien at improper time or place." This was the lead charge for 45.7 percent of all magistrate filings in April.
Other frequently prosecuted lead charges include: "08 USC 1326 - Reentry of deported alien" (38.5%).
Prosecutions in U.S. District Courts
In April 2017, 1,072 defendants in new cases for these matters were charged in the U.S. District Courts. There were an additional 1,161 defendants whose cases moved from the magistrate courts to the U.S. district courts after an indictment or information was filed. The sections which follow cover both sets of cases and therefore cover all matters filed in district court during April.Top Ranked Lead Charges
Table 2 shows the top lead charges recorded in the prosecutions of matters filed in U.S. District Court during April 2017 referred by the immigration and customs components of the Department of Homeland Security."Reentry of deported alien" (Title 8 U.S.C Section 1326) was the most frequent recorded lead charge. This has consistently ranked first during the last five years.
Ranked second in frequency was the lead charge "Bringing in and harboring certain aliens" under Title 8 U.S.C Section 1324. It has consistently been the second most common charge in district courts over the past five years.
Ranked third was "Drug Abuse Prevention & Control-Prohibited acts A" under Title 21 U.S.C Section 841. It was also ranked third a year ago, while it was ranked as the fourth most common offense five years ago.
Among these top ten lead charges, the one showing the greatest increase in prosecutions - up 14.5 percent - compared to one year ago was Title 8 U.S.C Section 1324 that involves "Bringing in and harboring certain aliens." This was the same statute that had the largest increase - 18.3 % - when compared with five years ago.
| Lead Charge | Count | Rank | 1yr ago | 5yrs ago |
| 08 USC 1326 - Reentry of deported alien | 1,231 | 1 | 1 | 1 |
|---|---|---|---|---|
| 08 USC 1324 - Bringing in and harboring certain aliens | 193 | 2 | 2 | 2 |
| 21 USC 841 - Drug Abuse Prevention & Control-Prohibited acts A | 171 | 3 | 3 | 4 |
| 21 USC 846 - Attempt and conspiracy | 135 | 4 | 4 | 3 |
| 21 USC 952 - Importation of controlled substances | 94 | 5 | 5 | 5 |
| 18 USC 922 - Firearms; Unlawful acts | 43 | 6 | 8 | 9 |
| 18 USC 2252 - Material involving sexual exploitation of minors | 32 | 7 | 7 | 8 |
| 18 USC 1546 - Fraud and misuse of visas, permits, and other documents | 28 | 8 | 6 | 6 |
| 18 USC 1544 - Misuse of passport | 13 | 9 | 9 | 10 |
| 21 USC 963 - Attempt and conspiracy | 13 | 9 | 11 | 15 |
Top Ranked Judicial Districts
Where criminal prosecutions are occurring in DHS-referred cases has undergone some geographic shifts. The District of New Mexico - with 12,201 prosecutions as compared with 834 prosecutions per ten million population in the United States - was the most active during April 2017. It also ranked first among districts relative to their population size during March 2017 as well. This represents a change since New Mexico was ranked only third a year ago, and it was ranked fifth five years ago.
Two out of three of the federal district court judges in the country that sentenced the largest number of these cases during April -- Robert C. Brack and Kenneth John Gonzales -- were also based in New Mexico. They were the second and third most active judges in the country on these types of cases. U.S. District Judge Alia M. Moses based in West Texas sentenced the most.
The Southern District of California (San Diego) ranked second most active after New Mexico. Just a year ago, this district had lagged behind the other four southwest border districts in terms of prosecutions of these matters relative to its population size. The remainder of the top ten ranked districts, in terms of prosecutions relative to their population size, are shown in Table 3.
In sheer numbers of DHS referred prosecutions, the five districts bordering Mexico accounted for two out of every three of these criminal prosecutions nationwide. Four out of five of these districts had quite similar numbers of prosecutions, ranging between 305 and 336 during April. See Table 3.
| Judicial District | Percapita | Count | Rank | 1yr ago | 5yrs ago |
|---|---|---|---|---|---|
| N Mexico | 12,201 | 212 | 1 | 3 | 5 |
| Cal, S | 10,518 | 305 | 2 | 5 | 3 |
| Texas, W | 5,623 | 327 | 3 | 2 | 2 |
| Arizona | 5,395 | 307 | 4 | 4 | 1 |
| Texas, S | 4,254 | 336 | 5 | 1 | 4 |
| N Dakota | 1,585 | 10 | 6 | 27 | 32 |
| Utah | 1,482 | 37 | 7 | 10 | 20 |
| Ala, S | 1,281 | 9 | 8 | 48 | 60 |
| Nebraska | 1,076 | 17 | 9 | 25 | 24 |
| Wyoming | 1,024 | 5 | 10 | 43 | 56 |