Immigration Court Post-Trump Cases: Latest Data
The latest available case-by-case Immigration Court records through the end of February 2017 give an early glimpse at what, if any, changes are emerging in deportation actions by the Department of Homeland Security (DHS). Because so little time has passed since the inauguration of Donald Trump as president on January 20, and given that DHS has broad administrative powers that under many circumstances allow it to bypass the Immigration Court when deporting noncitizens, these court data provide at best a very limited view of immigration enforcement activity around the country.
Court records reveal that so far, since Trump assumed office, a total of 11,040 cases have been initiated by DHS seeking removal orders. This represents the number of DHS Notices to Appear (NTAs), or comparable forms, dated after January 20, 2017 that had been filed in court as of the end of February 2017. NTAs are the official notification to an individual that DHS is seeking to deport them.
Because there is often a delay between the date of the NTA and the date it is filed and recorded by the Immigration Court, around half of the NTAs filed during the post-Trump period still reflect NTAs initiated under President Obama. This report focuses just on those NTA's that were dated after Trump assumed the presidency and have already been filed and recorded by the court. We refer to these as "post-Trump cases."
Because of these filing and recording delays, it is too soon to determine overall trends. However, some large shifts in the composition of post-Trump cases are suggestive:
The court is now seeing many more cases where the individual was detained at the time the case is filed, and fewer non-detained cases. See Figure 1.
California, as compared to Texas and New York, are seeing larger numbers proportionately than previously.
The court is receiving fewer cases from individuals who entered the country within the last year, including fewer unaccompanied juveniles and women with children seeking refuge in the U.S.
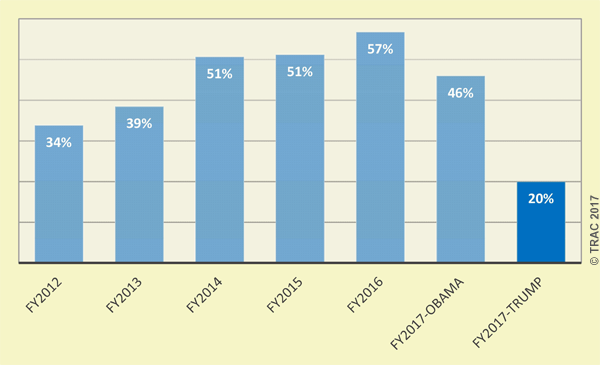
Figure 1. Proportion Never Detained After Immigration Court Case Filed
Details follow.
Where Cases Are Being Filed and Custody Status
The three states with the most Immigration Court filings remain the same. Texas has the most, followed by California, and then New York. However, as a share of total filings, courts in California have been seeing proportionately larger numbers than before; Texas courts fewer.
During FY 2012-FY 2016, California courts saw 15.3 percent of all cases. During FY 2017 (until January 20, 2017), California received only 12.7 percent, while with post-Trump cases the percentage is now 17.8 percent. In contrast, the post-Trump cases filed in Texas courts represented 21.1 percent of the nation's total, down from 24.2 percent during FY 2012-FY 2016. New York courts generally are seeing less than one out of every ten cases (9.4%), up slightly from levels of 8.4 percent during FY 2012- FY 2016 but down slightly from the first part of FY 2017.
Table 1 provides state-by-state numbers, including cases filed, what percent of the total each state represents, and state rankings. This table is based upon the "base city" of the court. Not all states have courts based in their state since some courts are assigned cases from surrounding states as well.
(click title to open in a new window)
| New Filings (by NTA date) | Percent | Rank | |||||||
| FY2012-FY2016 | FY2017 | FY2012-FY2016 | FY2017 | FY2012-FY2016 | FY2017 | ||||
| State | OBAMA | TRUMP | OBAMA | TRUMP | OBAMA | TRUMP | |||
| All | 1,116,370 | 57,233 | 11,040 | 100.0% | 100.0% | 100.0% | |||
| Texas | 270,574 | 14,024 | 2,326 | 24.2% | 24.5% | 21.1% | 1 | 1 | 1 |
| California | 171,139 | 7,290 | 1,967 | 15.3% | 12.7% | 17.8% | 2 | 2 | 2 |
| New York | 94,294 | 6,145 | 1,036 | 8.4% | 10.7% | 9.4% | 3 | 3 | 3 |
| Florida | 80,473 | 3,275 | 826 | 7.2% | 5.7% | 7.5% | 4 | 5 | 4 |
| Georgia | 50,364 | 2,784 | 726 | 4.5% | 4.9% | 6.6% | 6 | 6 | 5 |
| Arizona | 62,132 | 3,502 | 640 | 5.6% | 6.1% | 5.8% | 5 | 4 | 6 |
| Louisiana | 36,389 | 1,615 | 543 | 3.3% | 2.8% | 4.9% | 9 | 9 | 7 |
| New Jersey | 33,322 | 1,231 | 405 | 3.0% | 2.2% | 3.7% | 10 | 13 | 8 |
| Illinois | 41,303 | 2,218 | 298 | 3.7% | 3.9% | 2.7% | 7 | 8 | 9 |
| Colorado | 19,183 | 1,491 | 290 | 1.7% | 2.6% | 2.6% | 16 | 10 | 10 |
| Pennsylvania | 24,893 | 1,488 | 275 | 2.2% | 2.6% | 2.5% | 12 | 11 | 11 |
| Washington | 27,189 | 1,445 | 267 | 2.4% | 2.5% | 2.4% | 11 | 12 | 12 |
| Missouri | 10,979 | 1,231 | 243 | 1.0% | 2.2% | 2.2% | 20 | 14 | 13 |
| Virginia | 39,862 | 2,331 | 208 | 3.6% | 4.1% | 1.9% | 8 | 7 | 14 |
| Minnesota | 11,176 | 860 | 172 | 1.0% | 1.5% | 1.6% | 19 | 17 | 15 |
| Michigan | 10,213 | 515 | 153 | 0.9% | 0.9% | 1.4% | 22 | 20 | 16 |
| Nevada | 9,375 | 674 | 148 | 0.8% | 1.2% | 1.3% | 23 | 19 | 17 |
| Massachusetts | 21,078 | 484 | 123 | 1.9% | 0.8% | 1.1% | 14 | 22 | 18 |
| Maryland | 23,017 | 839 | 111 | 2.1% | 1.5% | 1.0% | 13 | 18 | 19 |
| Nebraska | 10,583 | 1,041 | 80 | 0.9% | 1.8% | 0.7% | 21 | 16 | 20 |
| Ohio | 11,743 | 497 | 69 | 1.1% | 0.9% | 0.6% | 18 | 21 | 21 |
| Connecticut | 5,216 | 289 | 44 | 0.5% | 0.5% | 0.4% | 25 | 23 | 22 |
| Utah | 6,567 | 263 | 31 | 0.6% | 0.5% | 0.3% | 24 | 25 | 23 |
| Tennessee | 16,731 | 1,192 | 19 | 1.5% | 2.1% | 0.2% | 17 | 15 | 24 |
| Hawaii | 1,070 | 80 | 15 | 0.1% | 0.1% | 0.1% | 28 | 27 | 25 |
| Oregon | 5,069 | 289 | 10 | 0.5% | 0.5% | 0.1% | 26 | 24 | 26 |
| Puerto Rico | 1,922 | 23 | 6 | 0.2% | 0.0% | 0.1% | 27 | 29 | 27 |
| Guam | 276 | 28 | 5 | 0.0% | 0.0% | 0.0% | 29 | 28 | 28 |
| North Carolina | 20,004 | 89 | 2 | 1.8% | 0.2% | 0.0% | 15 | 26 | 29 |
| Northern Mariana Isl | 234 | 0 | 2 | 0.0% | 0.0% | 0.0% | 30 | 30 | 30 |
Within states, courts that cover detained populations are seeing proportionately greater numbers. The Houston Detained court had the largest number of post-Trump cases thus far filed, slightly more than even the New York City court that historically had the highest case totals in the country and handles non-detained cases.
Indeed, a number of courts that handle detained populations have moved up in the rankings. The courts in third, fourth, and fifth place are all courts at detained locations. Adelanto, California had the third highest totals, followed by Oakdale, Louisiana and Pearsall, Texas. In sixth place was another court covering a detained population -- Krome in Miami, Florida.
Courts in Los Angeles, San Francisco, and Chicago all saw proportionately lower numbers of post-Trump cases filed. Table 2 provides details for each of the Immigration Courts.
(click title to open in a new window)
| New Cases (by NTA date) | Percent | Rank | |||||||
| FY2012-FY2016 | FY2017 | FY2012-FY2016 | FY2017 | FY2012-FY2016 | FY2017 | ||||
| Immigration Court | OBAMA | TRUMP | OBAMA | TRUMP | OBAMA | TRUMP | |||
| All | 1,116,370 | 57,233 | 11,040 | 100.0% | 100.0% | 100.0% | |||
| Houston - Detained TX) | 41,895 | 3,600 | 834 | 3.8% | 6.3% | 7.6% | 6 | 2 | 1 |
| New York (NY) | 75,829 | 5,002 | 825 | 6.8% | 8.7% | 7.5% | 1 | 1 | 2 |
| Adelanto (CA) | 21,046 | 1,090 | 659 | 1.9% | 1.9% | 6.0% | 23 | 21 | 3 |
| Oakdale (LA) | 26,108 | 1,299 | 529 | 2.3% | 2.3% | 4.8% | 14 | 16 | 4 |
| Pearsall (TX) | 25,860 | 1,354 | 501 | 2.3% | 2.4% | 4.5% | 15 | 12 | 5 |
| Miami - Krome (FL) | 25,046 | 1,322 | 452 | 2.2% | 2.3% | 4.1% | 16 | 13 | 6 |
| Los Angeles (CA) | 73,720 | 1,557 | 409 | 6.6% | 2.7% | 3.7% | 2 | 10 | 7 |
| San Francisco (CA) | 50,023 | 2,435 | 375 | 4.5% | 4.3% | 3.4% | 3 | 4 | 8 |
| Lumpkin (GA) | 26,614 | 1,031 | 369 | 2.4% | 1.8% | 3.3% | 13 | 23 | 9 |
| Atlanta (GA) | 23,750 | 1,753 | 357 | 2.1% | 3.1% | 3.2% | 18 | 7 | 10 |
| Imperial (CA) | 7,088 | 894 | 319 | 0.6% | 1.6% | 2.9% | 44 | 26 | 11 |
| Chicago (IL) | 41,303 | 2,218 | 298 | 3.7% | 3.9% | 2.7% | 7 | 6 | 12 |
| Eloy (AZ) | 24,131 | 1,258 | 298 | 2.2% | 2.2% | 2.7% | 17 | 17 | 13 |
| Florence (AZ) | 19,398 | 1,602 | 295 | 1.7% | 2.8% | 2.7% | 25 | 9 | 14 |
| Miami (FL) | 40,353 | 1,387 | 279 | 3.6% | 2.4% | 2.5% | 8 | 11 | 15 |
| El Paso (TX) | 27,718 | 1,643 | 252 | 2.5% | 2.9% | 2.3% | 12 | 8 | 16 |
| York (PA) | 15,790 | 783 | 252 | 1.4% | 1.4% | 2.3% | 29 | 31 | 17 |
| Kansas City (MO) | 10,979 | 1,231 | 243 | 1.0% | 2.2% | 2.2% | 35 | 18 | 18 |
| Tacoma (WA) | 18,445 | 1,016 | 242 | 1.7% | 1.8% | 2.2% | 27 | 24 | 19 |
| Dallas (TX) | 37,240 | 1,226 | 236 | 3.3% | 2.1% | 2.1% | 10 | 19 | 20 |
| Aurora (CO) | 10,471 | 699 | 235 | 0.9% | 1.2% | 2.1% | 37 | 34 | 21 |
| Elizabeth (NJ) | 12,129 | 729 | 217 | 1.1% | 1.3% | 2.0% | 32 | 32 | 22 |
| Arlington (VA) | 39,862 | 2,331 | 208 | 3.6% | 4.1% | 1.9% | 9 | 5 | 23 |
| San Diego (CA) | 19,262 | 1,314 | 205 | 1.7% | 2.3% | 1.9% | 26 | 14 | 24 |
| Los Fresnos (TX) | 21,585 | 904 | 204 | 1.9% | 1.6% | 1.8% | 20 | 25 | 25 |
| San Antonio (TX) | 44,001 | 1,300 | 195 | 3.9% | 2.3% | 1.8% | 5 | 15 | 26 |
| Newark (NJ) | 21,193 | 502 | 188 | 1.9% | 0.9% | 1.7% | 21 | 39 | 27 |
| Bloomington (MN) | 11,176 | 860 | 172 | 1.0% | 1.5% | 1.6% | 34 | 27 | 28 |
| Detroit (MI) | 10,213 | 515 | 153 | 0.9% | 0.9% | 1.4% | 39 | 38 | 29 |
| Las Vegas (NV) | 9,375 | 674 | 148 | 0.8% | 1.2% | 1.3% | 40 | 35 | 30 |
| Boston (MA) | 21,078 | 484 | 123 | 1.9% | 0.8% | 1.1% | 22 | 42 | 31 |
| Baltimore (MD) | 23,017 | 839 | 111 | 2.1% | 1.5% | 1.0% | 19 | 28 | 32 |
| Batavia (NY) | 6,374 | 445 | 98 | 0.6% | 0.8% | 0.9% | 46 | 43 | 33 |
| Orlando (FL) | 15,074 | 566 | 95 | 1.4% | 1.0% | 0.9% | 30 | 36 | 34 |
| Omaha (NE) | 10,583 | 1,041 | 80 | 0.9% | 1.8% | 0.7% | 36 | 22 | 35 |
| New York - Detained (NY) | 6,317 | 487 | 74 | 0.6% | 0.9% | 0.7% | 47 | 41 | 36 |
| Cleveland (OH) | 11,743 | 497 | 69 | 1.1% | 0.9% | 0.6% | 33 | 40 | 37 |
| Houston (TX) | 44,350 | 3,208 | 64 | 4.0% | 5.6% | 0.6% | 4 | 3 | 38 |
| Denver (CO) | 8,712 | 792 | 55 | 0.8% | 1.4% | 0.5% | 43 | 29 | 39 |
| Phoenix (AZ) | 14,489 | 553 | 47 | 1.3% | 1.0% | 0.4% | 31 | 37 | 40 |
| Hartford (CT) | 5,216 | 289 | 44 | 0.5% | 0.5% | 0.4% | 48 | 46 | 41 |
| Harlingen (TX) | 27,925 | 789 | 40 | 2.5% | 1.4% | 0.4% | 11 | 30 | 42 |
| West Valley (UT) | 6,567 | 263 | 31 | 0.6% | 0.5% | 0.3% | 45 | 48 | 43 |
| Seattle (WA) | 8,744 | 429 | 25 | 0.8% | 0.7% | 0.2% | 42 | 44 | 44 |
| Napanoch (NY) | 2,119 | 133 | 25 | 0.2% | 0.2% | 0.2% | 52 | 49 | 45 |
| Philadelphia (PA) | 9,103 | 705 | 23 | 0.8% | 1.2% | 0.2% | 41 | 33 | 46 |
| Memphis (TN) | 16,731 | 1,192 | 19 | 1.5% | 2.1% | 0.2% | 28 | 20 | 47 |
| Honolulu (HI) | 1,070 | 80 | 15 | 0.1% | 0.1% | 0.1% | 54 | 52 | 48 |
| New Orleans (LA) | 10,281 | 316 | 14 | 0.9% | 0.6% | 0.1% | 38 | 45 | 49 |
| Buffalo (NY) | 3,655 | 78 | 14 | 0.3% | 0.1% | 0.1% | 51 | 53 | 50 |
| Portland (OR) | 5,069 | 289 | 10 | 0.5% | 0.5% | 0.1% | 49 | 47 | 51 |
| Guaynabo (PR) | 1,922 | 23 | 6 | 0.2% | 0.0% | 0.1% | 53 | 55 | 52 |
| Hagatna (GU) | 276 | 28 | 5 | 0.0% | 0.0% | 0.0% | 55 | 54 | 53 |
| Charlotte (NC) | 20,004 | 89 | 2 | 1.8% | 0.2% | 0.0% | 24 | 50 | 54 |
| Saipan (MP) | 234 | 0 | 2 | 0.0% | 0.0% | 0.0% | 56 | 56 | 55 |
| Tucson (AZ) | 4,114 | 89 | 0 | 0.4% | 0.2% | 0.0% | 50 | 51 | 56 |
The court-by-court filing patterns that favor those courts specializing in detained cases, sum up to a national picture where four-out of five individuals in the post-Trump period were detained at the time their case was filed in Immigration Court. As shown earlier in Figure 1, only one in five were not detained. (Note that court detention tracks detention status from the time the case is actually filed in court; thus, individuals who were previously detained but released before the NTA was filed in court will be typically recorded as "never detained" in court records.)
Fewer Recent Arrivals
The mix of cases also reflect fewer recent arrivals. This is probably largely a reflection of the mix of cases arriving at the court - those from border apprehensions versus ICE interior apprehensions. But this does not necessarily imply that interior apprehensions have actually risen. It may simply reflect that cases referred by Customs and Border Protection (CBP) are down so that the proportion of interior cases have risen. According to CBP, apprehensions between ports of entry as well those arrested at border crossings were down sharply in February. See Southwest Border Migration.
Immigration Court records show a total of 41 percent of post-Trump cases had entered the country within 365 days of their entry into this country, down from 62 percent in the last full fiscal year of the Obama Administration when a high priority was deporting recent arrivals to this country, along with noncitizens convicted of serious crimes or who had previously been ordered removed since January 1, 2014. See Table 3. However, this post-Trump percentage for recent arrivals is still considerable higher than five years ago. During FY 2012 only 20 percent had been recent arrivals.
| FY2017 | |||||||
| Recency of Entry | FY2012 | FY2013 | FY2014 | FY2015 | FY2016 | OBAMA | TRUMP |
| Total Number of Cases Filed | 214,498 | 201,284 | 264,658 | 193,074 | 242,856 | 57,233 | 11,040 |
| Number | |||||||
| Entered within 1 Year | 42,339 | 69,077 | 140,399 | 101,650 | 151,024 | 36,225 | 4,549 |
| Entered 1-2 years | 5,530 | 4,585 | 4,871 | 5,035 | 3,051 | 632 | 202 |
| Entered longer ago* | 166,629 | 127,622 | 119,388 | 86,389 | 88,781 | 20,376 | 6,289 |
| Percent | |||||||
| Entered within 1 Year | 20% | 34% | 53% | 53% | 62% | 63% | 41% |
| Entered 1-2 years | 3% | 2% | 2% | 3% | 1% | 1% | 2% |
| Entered longer ago* | 78% | 63% | 45% | 45% | 37% | 36% | 57% |
After FY 2012, the large number of unaccompanied children and women with children seeking refuge in this country helped pushed the proportion of recent arrivals on the court docket to unusually high levels during the latter years of the Obama Administration. However, only 110 out of the 11,040 post-Trump cases involved unaccompanied children, and only 210 involved woman with children removal cases. See Table 4.
| FY2017 | |||||||
| Recency of Entry | FY2012 | FY2013 | FY2014 | FY2015 | FY2016 | OBAMA | TRUMP |
| Total Number of Cases Filed | 214,498 | 201,284 | 264,658 | 193,074 | 242,856 | 57,233 | 11,040 |
| Number | |||||||
| Unaccompanied Children | 11,491 | 22,324 | 56,562 | 31,118 | 43,929 | 5,228 | 110 |
| Mothers with Children* | 34 | 212 | 33,112 | 42,690 | 72,335 | 15,634 | 210 |
| Percent | |||||||
| Unaccompanied Children | 5.4% | 11.1% | 21.4% | 16.1% | 18.1% | 9.1% | 1.0% |
| Mothers with Children* | 0.0% | 0.1% | 12.5% | 22.1% | 29.8% | 27.3% | 1.9% |
Legal Grounds Cited for Seeking Removal Orders
Over nine out of ten post-Trump cases rely on immigration charges as the basis for seeking a removal order. About 40 percent are for illegal entry, while 51 percent were for other immigration charges. The most common of these other types of immigration charges were for no" current valid immigrant visa," or simply "being present in the country in violation of the law." In only 2 percent of the cases were persons charged with having an aggravated felony, while an additional 6 percent were charged with participating in other types of criminal behavior. There were no terrorism charges, and just 3 cases where the individual was charged with a "national security violation."
While this pattern is not dissimilar to the pattern of charges observed in Immigration Court cases under President Obama, there has been a shift away from illegal entry as the grounds for seeking deportation and a rise in other immigration offenses, such as not currently having a valid immigrant visa which can occur if the person entered legally and then stayed beyond the period permitted under their visa.
Table 5 provides a year-by-year comparison of the most serious grounds DHS cited for seeking a removal order in Immigration Court, while Table 6 lists the top 10 specific charges in post-Trump cases along with similar numbers for these charges in earlier years.
| FY2017 | |||||||
| Most Serious Charge | FY2012 | FY2013 | FY2014 | FY2015 | FY2016 | OBAMA | TRUMP |
| Other Immigration Violation | 24.0% | 32.5% | 29.5% | 41.1% | 48.1% | 45.4% | 51.3% |
| Entry Without Inspection | 59.8% | 52.7% | 61.1% | 47.5% | 43.5% | 46.6% | 40.2% |
| Other Criminal | 11.4% | 10.3% | 6.3% | 7.7% | 4.9% | 4.6% | 6.1% |
| Aggravated Felony | 4.5% | 4.1% | 2.6% | 3.2% | 2.1% | 2.1% | 2.3% |
| Other Charges | 0.2% | 0.4% | 0.5% | 0.5% | 1.5% | 1.2% | 0.1% |
| National Security | 0.0% | 0.0% | 0.0% | 0.0% | 0.0% | 0.0% | 0.0% |
| Terrorism | 0.0% | 0.0% | 0.0% | 0.0% | 0.0% | none | none |
| FY2017 | |||||||
| Specific Legal Grounds | FY2012 | FY2013 | FY2014 | FY2015 | FY2016 | OBAMA | TRUMP |
| All Charges* | 354,128 | 345,047 | 410,282 | 282,513 | 330,490 | 70,633 | 11,805 |
| Alien in U.S. without admission or parole [1182a06Ai] | 204,256 | 177,017 | 235,820 | 123,018 | 133,044 | 30,624 | 4,739 |
| No valid immigrant visa [1182a07Ai I] | 39,948 | 78,270 | 98,482 | 96,435 | 145,934 | 29,590 | 4,181 |
| Any alien present in violation of the act [1227a01B] | 30,799 | 22,126 | 20,333 | 15,415 | 10,855 | 2,703 | 1,324 |
| Convicted of aggravated felony [1227a02Aiii] | 14,905 | 12,784 | 10,455 | 9,337 | 7,429 | 1,518 | 276 |
| Crimes involving moral turpitude [1182a02Ai I] | 11,338 | 9,055 | 7,253 | 6,134 | 4,713 | 954 | 210 |
| Non-immigrant status violators. Any alien who was admitted as a non-immigrant and failed to maintain that status. [1227a01Ci] | 7,313 | 4,589 | 4,116 | 3,357 | 2,235 | 462 | 197 |
| Controlled substance violation [1182a02Ai II] | 8,972 | 7,022 | 5,394 | 4,558 | 3,670 | 720 | 171 |
| Controlled substance conviction [1227a02Bi] | 8,547 | 7,299 | 5,889 | 4,984 | 3,860 | 772 | 166 |
| Fraud or willful misrepresentation to procure a visa, documentation or admission into the U.S. [1182a06Ci] | 2,984 | 3,025 | 2,503 | 2,207 | 1,631 | 320 | 69 |
| Convicted of two or more crimes involving moral turpitude [1227a02Aii] | 4,521 | 3,630 | 2,596 | 2,198 | 1,562 | 322 | 66 |
Nationality
Table 7 provides a breakdown of cases by nationality. There are proportionately more cases involving individuals from Mexico (29%) than over the last five years during Obama's presidency (24%), and fewer from Guatemala, El Salvador and Honduras. Indeed, during FY 2016 and the early months of FY 2017 while President Obama was still in office, individuals from El Salvador outnumbered those from Mexico in the cases that DHS brought.
(click title to open in a new window)
| FY2017 | |||||||
| Nationality | FY2012 | FY2013 | FY2014 | FY2015 | FY2016 | OBAMA | TRUMP |
| All | 214,498 | 201,284 | 264,658 | 193,074 | 242,856 | 57,233 | 11,040 |
| Mexico | 107,037 | 75,921 | 65,962 | 56,204 | 51,002 | 10,842 | 3,156 |
| Guatemala | 20,246 | 24,631 | 39,830 | 35,722 | 48,365 | 11,630 | 1,391 |
| El Salvador | 16,694 | 24,683 | 51,460 | 34,090 | 59,338 | 13,055 | 1,344 |
| Honduras | 14,166 | 22,742 | 57,210 | 22,730 | 36,200 | 8,836 | 1,079 |
| Haiti | 1,861 | 1,983 | 1,417 | 1,351 | 3,817 | 2,680 | 830 |
| China | 10,222 | 7,195 | 7,405 | 6,000 | 5,171 | 1,324 | 543 |
| India | 1,950 | 4,385 | 2,785 | 3,287 | 4,678 | 1,179 | 453 |
| Ecuador | 3,230 | 4,793 | 6,066 | 3,701 | 3,915 | 824 | 243 |
| Cuba | 3,581 | 2,684 | 1,351 | 1,240 | 1,057 | 258 | 126 |
| Brazil | 1,382 | 1,007 | 1,082 | 1,364 | 2,693 | 715 | 120 |
| Nepal | 770 | 822 | 894 | 1,086 | 1,082 | 218 | 111 |
| Bangladesh | 341 | 460 | 1,046 | 1,281 | 1,134 | 188 | 97 |
| Dominican Republic | 2,977 | 2,750 | 2,488 | 2,104 | 1,872 | 328 | 78 |
| Eritrea | 178 | 148 | 218 | 273 | 352 | 159 | 73 |
| Soviet Union | 359 | 333 | 222 | 209 | 239 | 86 | 69 |
| Pakistan | 618 | 583 | 542 | 730 | 810 | 266 | 60 |
| Nicaragua | 1,170 | 1,367 | 1,650 | 990 | 1,105 | 349 | 59 |
| Peru | 1,243 | 1,284 | 1,314 | 843 | 899 | 234 | 56 |
| Somalia | 273 | 361 | 422 | 851 | 542 | 98 | 46 |
| Colombia | 1,500 | 1,492 | 1,184 | 1,117 | 955 | 207 | 44 |
| Sri Lanka | 325 | 246 | 198 | 243 | 191 | 30 | 41 |
| Iraq | 231 | 248 | 316 | 352 | 293 | 102 | 41 |
| Philippines | 1,067 | 922 | 731 | 501 | 443 | 80 | 36 |
| Guinea | 213 | 137 | 126 | 124 | 262 | 78 | 35 |
| Russia | 681 | 507 | 447 | 485 | 374 | 94 | 34 |
| Armenia | 170 | 179 | 246 | 364 | 543 | 108 | 34 |
| Jamaica | 1,890 | 1,661 | 1,267 | 1,062 | 936 | 189 | 33 |
| Ukraine | 444 | 345 | 344 | 482 | 445 | 149 | 33 |
| Ghana | 414 | 501 | 492 | 777 | 891 | 123 | 30 |
| Unknown Nationality | 95 | 99 | 108 | 72 | 72 | 40 | 29 |
| Egypt | 610 | 431 | 486 | 510 | 394 | 88 | 26 |
| Nigeria | 604 | 686 | 717 | 649 | 556 | 130 | 26 |
| Romania | 1,016 | 632 | 514 | 512 | 1,910 | 176 | 24 |
| Syria | 201 | 451 | 327 | 320 | 273 | 64 | 22 |
| Cameroon | 325 | 402 | 430 | 322 | 516 | 176 | 21 |
| Saudi Arabia | 156 | 201 | 179 | 193 | 146 | 41 | 21 |
| Burkina Faso | 162 | 167 | 190 | 169 | 141 | 23 | 19 |
| Venezuela | 627 | 462 | 476 | 405 | 528 | 130 | 17 |
| Vietnam | 601 | 461 | 418 | 378 | 330 | 61 | 17 |
| Gambia | 304 | 134 | 118 | 119 | 148 | 55 | 15 |
| Albania | 252 | 461 | 568 | 166 | 200 | 54 | 15 |
| Trinidad and Tobago | 463 | 416 | 311 | 265 | 226 | 32 | 14 |
| Ethiopia | 429 | 544 | 702 | 495 | 350 | 93 | 14 |
| Poland | 426 | 293 | 244 | 212 | 205 | 23 | 14 |
| Iran | 321 | 305 | 339 | 339 | 203 | 49 | 14 |
| Jordan | 256 | 223 | 304 | 300 | 210 | 43 | 14 |
| Senegal | 246 | 169 | 118 | 119 | 269 | 51 | 14 |
| Canada | 691 | 559 | 494 | 377 | 305 | 50 | 13 |
| Turkey | 232 | 206 | 233 | 223 | 205 | 51 | 13 |
| Georgia | 65 | 66 | 50 | 71 | 87 | 20 | 12 |
| Costa Rica | 302 | 277 | 239 | 147 | 137 | 35 | 11 |
| Israel | 251 | 309 | 346 | 263 | 143 | 28 | 11 |
| Kirghizia (Kyrgyzstan) | 145 | 190 | 195 | 163 | 121 | 29 | 11 |
| United Kingdom | 335 | 318 | 240 | 195 | 177 | 31 | 10 |
| Uzebekistan | 162 | 142 | 191 | 134 | 148 | 25 | 10 |
| Sudan | 158 | 125 | 157 | 88 | 92 | 25 | 10 |
| Rwanda | 68 | 109 | 67 | 71 | 36 | 16 | 10 |
| Ivory Coast (Cote D'ivoire) | 210 | 142 | 99 | 104 | 88 | 12 | 9 |
| Indonesia | 274 | 135 | 118 | 97 | 53 | 8 | 8 |
| Mali | 235 | 147 | 128 | 119 | 120 | 17 | 8 |
| Belize | 197 | 210 | 164 | 118 | 149 | 20 | 8 |
| Lebanon | 169 | 170 | 131 | 146 | 77 | 23 | 8 |
| Afghanistan | 108 | 81 | 95 | 95 | 137 | 38 | 8 |
| Zimbabwe | 100 | 53 | 61 | 42 | 41 | 6 | 8 |
| Burma (Myanmar) | 95 | 69 | 98 | 76 | 64 | 15 | 8 |
| Togo | 53 | 29 | 42 | 43 | 77 | 20 | 8 |
| Angola | 22 | 33 | 38 | 60 | 55 | 17 | 8 |
| South Korea | 472 | 406 | 330 | 249 | 155 | 35 | 7 |
| Uganda | 112 | 71 | 88 | 66 | 55 | 11 | 7 |
| Yemen | 81 | 93 | 76 | 82 | 85 | 21 | 7 |
| Federated States of Micronesia | 53 | 46 | 62 | 46 | 63 | 32 | 7 |
| Azerbaijan | 43 | 46 | 54 | 41 | 25 | 5 | 7 |
| Bolivia | 259 | 201 | 239 | 147 | 110 | 21 | 6 |
| Argentina | 177 | 205 | 152 | 125 | 75 | 22 | 6 |
| Congo | 82 | 88 | 85 | 100 | 75 | 30 | 6 |
| Libya | 63 | 21 | 42 | 35 | 24 | 13 | 6 |
| Kenya | 594 | 352 | 446 | 425 | 201 | 40 | 5 |
| Guyana | 276 | 248 | 224 | 202 | 155 | 31 | 5 |
| Mongolia | 199 | 98 | 86 | 89 | 63 | 13 | 5 |
| Thailand | 194 | 186 | 165 | 110 | 86 | 15 | 5 |
| Kosovo | 70 | 76 | 83 | 52 | 75 | 26 | 5 |
| Algeria | 46 | 30 | 33 | 28 | 30 | 5 | 5 |
| Moldavia (Moldova) | 233 | 201 | 138 | 188 | 104 | 33 | 4 |
| Bahamas | 150 | 168 | 94 | 86 | 67 | 11 | 4 |
| Chile | 148 | 124 | 106 | 90 | 66 | 14 | 4 |
| Kazakhstan | 135 | 123 | 114 | 130 | 76 | 15 | 4 |
| Bosnia-Herzegovina | 128 | 131 | 114 | 121 | 88 | 24 | 4 |
| Sierra Leone | 127 | 89 | 93 | 65 | 63 | 26 | 4 |
| South Africa | 88 | 95 | 64 | 47 | 41 | 8 | 4 |
| Malaysia | 73 | 47 | 56 | 35 | 49 | 5 | 4 |
| Palestine | 24 | 28 | 29 | 17 | 33 | 8 | 4 |
| Bhutan | 11 | 13 | 15 | 25 | 17 | 8 | 4 |
| Liberia | 240 | 182 | 151 | 126 | 119 | 39 | 3 |
| Morocco | 151 | 124 | 117 | 119 | 76 | 11 | 3 |
| Italy | 117 | 112 | 107 | 70 | 85 | 19 | 3 |
| Bulgaria | 107 | 70 | 67 | 43 | 44 | 6 | 3 |
| Spain | 93 | 98 | 81 | 52 | 47 | 15 | 3 |
| Uruguay | 84 | 77 | 45 | 43 | 36 | 7 | 3 |
| Stateless - Alien Unable to Name A Country | 67 | 43 | 39 | 49 | 39 | 16 | 3 |
| Democratic Republic of Congo | 66 | 78 | 73 | 88 | 89 | 23 | 3 |
| Serbia Montenegro | 59 | 60 | 46 | 41 | 36 | 11 | 3 |
| Mauritania | 57 | 48 | 71 | 68 | 44 | 9 | 3 |
| Cambodia | 161 | 126 | 106 | 99 | 64 | 11 | 2 |
| Cape Verde | 121 | 63 | 41 | 39 | 37 | 5 | 2 |
| France | 90 | 100 | 68 | 59 | 48 | 5 | 2 |
| Barbados | 70 | 36 | 45 | 27 | 22 | 3 | 2 |
| Fiji | 60 | 49 | 38 | 39 | 27 | 6 | 2 |
| Japan | 60 | 45 | 38 | 27 | 27 | 3 | 2 |
| Ireland | 59 | 43 | 39 | 31 | 33 | 6 | 2 |
| Taiwan | 54 | 62 | 42 | 44 | 44 | 8 | 2 |
| Netherlands | 50 | 50 | 31 | 19 | 18 | 6 | 2 |
| Slovak Republic | 43 | 32 | 18 | 12 | 19 | 4 | 2 |
| Australia | 40 | 41 | 41 | 40 | 24 | 8 | 2 |
| Guadeloupe | 10 | 11 | 22 | 16 | 45 | 7 | 2 |
| United Arab Emirates | 7 | 8 | 15 | 11 | 6 | 2 | 2 |
| North Korea | 7 | 6 | 6 | 1 | 4 | 1 | 2 |
| Laos | 256 | 210 | 156 | 111 | 108 | 24 | 1 |
| Panama | 154 | 144 | 79 | 86 | 80 | 8 | 1 |
| Germany | 133 | 151 | 95 | 95 | 75 | 11 | 1 |
| Hungary | 89 | 58 | 50 | 40 | 36 | 4 | 1 |
| Yugoslavia | 74 | 68 | 61 | 44 | 31 | 9 | 1 |
| Lithuania | 71 | 53 | 31 | 22 | 22 | 4 | 1 |
| Tajikistan (Tadzhik) | 64 | 50 | 50 | 55 | 36 | 2 | 1 |
| Grenada | 64 | 43 | 41 | 29 | 25 | 4 | 1 |
| Macedonia | 56 | 50 | 26 | 35 | 34 | 14 | 1 |
| St. Lucia | 53 | 54 | 42 | 37 | 24 | 4 | 1 |
| Greece | 46 | 54 | 45 | 20 | 24 | 2 | 1 |
| Tunisia | 36 | 31 | 41 | 32 | 24 | 4 | 1 |
| Paraguay | 34 | 28 | 13 | 11 | 22 | 4 | 1 |
| Latvia | 28 | 24 | 24 | 15 | 11 | 2 | 1 |
| Kuwait | 25 | 22 | 22 | 41 | 15 | 7 | 1 |
| Croatia | 23 | 21 | 8 | 17 | 11 | 3 | 1 |
| Central African Republic | 17 | 16 | 18 | 16 | 8 | 0 | 1 |
| Montenegro | 16 | 14 | 12 | 15 | 13 | 3 | 1 |
| The Republic of Palau | 16 | 11 | 18 | 6 | 10 | 5 | 1 |
| Malawi | 16 | 11 | 16 | 9 | 9 | 4 | 1 |
| Djibouti | 15 | 12 | 17 | 15 | 8 | 9 | 1 |
| Suriname | 15 | 5 | 7 | 12 | 10 | 1 | 1 |
| Macau | 12 | 11 | 9 | 3 | 5 | 2 | 1 |
| Czechoslovakia | 10 | 12 | 6 | 1 | 2 | 0 | 1 |
| Norway | 10 | 4 | 4 | 3 | 6 | 0 | 1 |
| Netherlands Antilles | 5 | 2 | 3 | 3 | 2 | 0 | 1 |
| Namibia | 4 | 4 | 2 | 4 | 4 | 0 | 1 |
| Swaziland | 3 | 0 | 3 | 4 | 2 | 1 | 1 |
| Solomon Islands | 2 | 0 | 0 | 0 | 0 | 0 | 1 |
| Midway Islands | 0 | 0 | 1 | 0 | 1 | 0 | 1 |
| Portugal | 146 | 102 | 81 | 66 | 82 | 15 | 0 |
| Belarus | 117 | 75 | 58 | 69 | 50 | 7 | 0 |
| Tonga | 70 | 36 | 29 | 29 | 20 | 3 | 0 |
| Niger | 65 | 42 | 34 | 42 | 32 | 9 | 0 |
| Tanzania | 64 | 82 | 128 | 52 | 39 | 11 | 0 |
| Burundi | 63 | 60 | 46 | 64 | 52 | 22 | 0 |
| Czech Republic | 62 | 51 | 31 | 21 | 22 | 6 | 0 |
| Dominica | 59 | 59 | 27 | 27 | 23 | 7 | 0 |
| Zambia | 45 | 35 | 31 | 28 | 17 | 1 | 0 |
| Byelorussia (Belarus) | 45 | 15 | 10 | 0 | 1 | 0 | 0 |
| Antigua and Barbuda | 39 | 37 | 31 | 19 | 18 | 4 | 0 |
| Hong Kong | 32 | 13 | 20 | 20 | 23 | 5 | 0 |
| St. Vincent and the Grenadines | 30 | 30 | 32 | 30 | 15 | 1 | 0 |
| Benin | 26 | 34 | 34 | 34 | 29 | 7 | 0 |
| Sweden | 24 | 34 | 19 | 14 | 17 | 3 | 0 |
| Samoa | 23 | 26 | 15 | 9 | 16 | 1 | 0 |
| St. Kitts, West Indies | 22 | 32 | 25 | 18 | 9 | 3 | 0 |
| Turkmenistan | 22 | 17 | 14 | 16 | 13 | 4 | 0 |
| Estonia | 20 | 16 | 17 | 11 | 6 | 1 | 0 |
| Bermuda | 18 | 9 | 3 | 5 | 2 | 0 | 0 |
| New Zealand | 17 | 27 | 16 | 25 | 14 | 2 | 0 |
| The Republic of the Marshall Islands | 16 | 25 | 22 | 25 | 16 | 4 | 0 |
| Gabon | 16 | 14 | 19 | 11 | 7 | 7 | 0 |
| Singapore | 15 | 15 | 10 | 5 | 13 | 4 | 0 |
| Belgium | 14 | 24 | 21 | 8 | 10 | 1 | 0 |
| Turks and Caicos Islands | 12 | 6 | 3 | 4 | 6 | 2 | 0 |
| Denmark | 11 | 8 | 11 | 4 | 4 | 1 | 0 |
| British Virgin Islands | 10 | 8 | 5 | 0 | 1 | 0 | 0 |
| Cayman Islands | 10 | 6 | 1 | 1 | 3 | 0 | 0 |
| Chad | 9 | 17 | 25 | 24 | 14 | 2 | 0 |
| Austria | 8 | 13 | 7 | 8 | 6 | 0 | 0 |
| South Sudan | 7 | 9 | 24 | 8 | 17 | 5 | 0 |
| Switzerland | 7 | 8 | 7 | 10 | 3 | 1 | 0 |
| Cyprus | 7 | 5 | 4 | 7 | 1 | 0 | 0 |
| Bahrain | 7 | 4 | 2 | 7 | 0 | 0 | 0 |
| Niue | 7 | 3 | 5 | 0 | 0 | 0 | 0 |
| Anguilla | 6 | 5 | 2 | 1 | 2 | 0 | 0 |
| Finland | 6 | 3 | 3 | 6 | 2 | 3 | 0 |
| Mozambique | 5 | 4 | 2 | 6 | 6 | 0 | 0 |
| Botswana | 5 | 4 | 2 | 3 | 4 | 0 | 0 |
| Iceland | 5 | 1 | 4 | 1 | 6 | 1 | 0 |
| Mauritius | 4 | 6 | 1 | 4 | 1 | 0 | 0 |
| Montserrat | 4 | 2 | 1 | 1 | 0 | 0 | 0 |
| Slovenia | 4 | 1 | 1 | 3 | 2 | 0 | 0 |
| Holland | 3 | 12 | 36 | 5 | 18 | 1 | 0 |
| Zaire | 3 | 10 | 3 | 0 | 0 | 0 | 0 |
| East Germany | 3 | 7 | 20 | 9 | 13 | 2 | 0 |
| Guinea Bissau | 3 | 3 | 4 | 7 | 6 | 0 | 0 |
| Papua New Guinea | 3 | 2 | 0 | 0 | 3 | 1 | 0 |
| Seychelles | 2 | 4 | 1 | 0 | 0 | 0 | 0 |
| Equatorial Guinea | 2 | 3 | 5 | 3 | 6 | 3 | 0 |
| Qatar | 2 | 2 | 4 | 2 | 3 | 2 | 0 |
| Comoro Islands | 2 | 1 | 1 | 0 | 0 | 1 | 0 |
| Oman | 2 | 1 | 0 | 3 | 1 | 0 | 0 |
| Brunei | 2 | 1 | 0 | 0 | 0 | 0 | 0 |
| Malta | 1 | 6 | 1 | 1 | 2 | 0 | 0 |
| Madagascar | 1 | 2 | 3 | 3 | 0 | 0 | 0 |
| Aruba | 1 | 2 | 2 | 3 | 1 | 0 | 0 |
| Lesotho | 1 | 1 | 0 | 2 | 0 | 0 | 0 |
| Upper Volta | 1 | 1 | 0 | 0 | 1 | 0 | 0 |
| Gaza Strip | 1 | 0 | 1 | 1 | 0 | 0 | 0 |
| Luxembourg | 1 | 0 | 1 | 0 | 1 | 0 | 0 |
| Sao Tome and Principe | 1 | 0 | 0 | 1 | 0 | 0 | 0 |
| No Nationality | 1 | 0 | 0 | 0 | 0 | 0 | 0 |
| Western Sahara | 1 | 0 | 0 | 0 | 0 | 0 | 0 |
| Martinique | 0 | 2 | 0 | 0 | 0 | 0 | 0 |
| People's Republic of Benin | 0 | 1 | 1 | 2 | 5 | 0 | 0 |
| French Polynesia | 0 | 1 | 1 | 0 | 2 | 0 | 0 |
| Kiribati | 0 | 1 | 1 | 0 | 1 | 0 | 0 |
| Reunioun | 0 | 1 | 1 | 0 | 1 | 0 | 0 |
| St. Christopher-Nevis | 0 | 1 | 1 | 0 | 1 | 0 | 0 |
| Cocos Island | 0 | 1 | 0 | 1 | 0 | 1 | 0 |
| Faeroe Island | 0 | 1 | 0 | 0 | 1 | 0 | 0 |
| Kampuchea | 0 | 1 | 0 | 0 | 0 | 0 | 0 |
| East Timor | 0 | 1 | 0 | 0 | 0 | 0 | 0 |
| Gibraltar | 0 | 1 | 0 | 0 | 0 | 0 | 0 |
| French Guiana | 0 | 1 | 0 | 0 | 0 | 0 | 0 |
| San Marino | 0 | 0 | 1 | 0 | 0 | 0 | 0 |
| Nauru | 0 | 0 | 1 | 0 | 0 | 0 | 0 |
| Heard and Mcdonald Islands | 0 | 0 | 1 | 0 | 0 | 0 | 0 |
| Christmas Islands | 0 | 0 | 0 | 0 | 1 | 0 | 0 |
| British Indian Ocean Territory | 0 | 0 | 0 | 0 | 0 | 1 | 0 |
New ICE Barriers to Data Access
TRAC will continue to monitor immigration enforcement actions under the Trump Administration as additional data becomes available. We anticipate that we will be able to update these Immigration Court numbers on a monthly basis, as we receive new data from the courts in response to our regular Freedom of Information requests for updates.
Unfortunately, Immigration and Customs Enforcement (ICE) has started withholding other more comprehensive information that ICE previously released to TRAC in response to Freedom of Information Act (FOIA) requests. ICE does not claim the withheld information is exempt from disclosure, it simply claims past releases were discretionary and it is no longer willing to make many of these details available to the public.
Because of these ICE refusals, TRAC is unable to update its online free web query tools that allow the public to view ICE activities under both the previous Bush and Obama Administrations. We are also currently in court on another FOIA action trying to obtain ICE records on what fields of information the agency's databases actually track. Even though ICE released these descriptive documents before, ICE now refuses to provide updated listings describing its data. Our brief in that litigation was filed March 10.