Immigration Judges Decide 57 Percent Entitled to Remain in U.S.
During the first ten months of FY 2016, immigration judges have determined that 96,223 noncitizens against whom Homeland Security sought removal orders were entitled to remain in this country. By the end of this fiscal year this pace is on track to surpass the record set last year of 106,676 noncitizens that the court found could remain in the U.S. These outcomes account for 56.8 percent of all cases that judges have decided so far this year. See Figure 1.
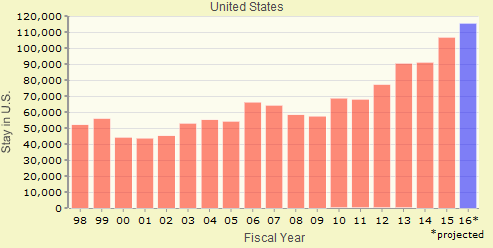
Figure 1. Individuals allowed to stay, FY1998-FY2016
Go to Immigration Court Deportation Outcomes tool for details
One in four individuals (25%) allowed to stay was from Mexico. Over four out of ten (44%) were from the three Central American countries — El Salvador, Guatemala, and Honduras — where in recent years large numbers of unaccompanied children and women with children have come to this country seeking asylum. These figures are based upon case-by-case court records updated through the end of July 2016 obtained and analyzed by the Transactional Records Access Clearinghouse at Syracuse University.
There are a number of reasons why an individual may be allowed to remain in the country. For example, the judge can find that the government did not meet its burden to show the individual was deportable. Or, the judge may have found that the individual was entitled to asylum in this country, or may grant relief from removal under other provisions of the law. A person also may be allowed to remain because the government requests that the case be administratively closed through the exercise of ICE's prosecutorial discretion, or for some other reason.
Deportation Outcomes by Immigration Court
A free web app allows users to examine these cases in more detail by nationality, charge, Immigration Court, and hearing location. Outcomes, for example, vary markedly by Immigration Court. The Phoenix Immigration Court had the highest proportion of individuals who were allowed to stay. In more than four out of every five (82.2%) of its 3,554 cases closed so far in FY 2016 the individuals were successful in their quest to remain in the U.S.
The New York Immigration Court was in second place with 81.5 percent of the individuals in its 16,152 cases closed so far this year allowed to remain in the U.S. The Denver Immigration Court came in third with 78.0 percent of the 831 individuals in its cases successful in their quest to stay in this country.
At the other extreme were the Oakdale, Louisiana, Lumpkin (Stewart), Georgia, and Napanoch (Ulster), New York Immigration Courts where only between 11.3 percent and 17.5 percent of the individuals were allowed to remain in the U.S. Each of these courts handle cases for individuals who are held in detention.
Similar figures, including rankings, for each of the 55 Immigration Courts are listed below in Table 1.
| Immigration Court | Closed Cases | Percent Allowed Stay | Rank |
|---|---|---|---|
| All Courts | 169,258 | 56.8 | |
| Phoenix | 3,554 | 82.2 | 1 |
| New York | 16,152 | 81.5 | 2 |
| Denver | 831 | 78.0 | 3 |
| San Antonio | 3,704 | 76.8 | 4 |
| Miami | 7,513 | 75.8 | 5 |
| Newark | 3,358 | 75.1 | 6 |
| Philadelphia | 2,325 | 74.1 | 7 |
| Boston | 4,142 | 73.9 | 8 |
| Guaynabo | 186 | 71.5 | 9 |
| Los Angeles | 17,981 | 70.4 | 10 |
| San Francisco | 9,447 | 70.3 | 11 |
| Honolulu | 353 | 68.8 | 12 |
| Cleveland | 2,202 | 64.9 | 13 |
| Detroit | 1,915 | 64.8 | 14 |
| Portland | 1,037 | 64.0 | 15 |
| New Orleans | 3,067 | 63.1 | 16 |
| Baltimore | 4,247 | 61.8 | 17 |
| Seattle | 2,440 | 61.7 | 18 |
| Arlington | 7,082 | 61.0 | 19 |
| Las Vegas | 2,738 | 60.4 | 20 |
| Bloomington | 1,563 | 59.3 | 21 |
| San Diego | 2,415 | 58.1 | 22 |
| Memphis | 5,189 | 57.5 | 23 |
| Orlando | 3,204 | 56.3 | 24 |
| Hartford | 1,166 | 55.3 | 25 |
| Omaha | 1,403 | 54.5 | 26 |
| Saipan | 13 | 53.8 | 27 |
| Pearsall | 1,594 | 53.5 | 28 |
| Kansas City | 1,760 | 52.8 | 29 |
| Hagatna | 21 | 52.4 | 30 |
| Buffalo | 1,299 | 52.0 | 31 |
| Los Fresnos | 1,505 | 46.1 | 32 |
| Chicago | 3,456 | 45.4 | 33 |
| El Paso | 3,183 | 45.3 | 34 |
| Imperial | 393 | 43.3 | 35 |
| Atlanta | 7,278 | 41.0 | 36 |
| Tucson | 734 | 41.0 | 36 |
| Aurora | 786 | 40.2 | 38 |
| Harlingen | 1,929 | 38.5 | 39 |
| Elizabeth | 1,156 | 38.0 | 40 |
| West Valley | 821 | 37.3 | 41 |
| Houston - Detained | 3,657 | 36.3 | 42 |
| Tacoma | 1,572 | 34.9 | 43 |
| York | 1,336 | 31.8 | 44 |
| Miami - Krome | 2,177 | 31.8 | 44 |
| New York - Detain | 632 | 29.4 | 46 |
| Florence | 1,004 | 28.9 | 47 |
| Adelanto | 1,789 | 26.2 | 48 |
| Charlotte | 4,153 | 25.9 | 49 |
| Dallas | 6,826 | 23.8 | 50 |
| Houston | 4,807 | 21.0 | 51 |
| Eloy | 1,466 | 19.4 | 52 |
| Oakdale | 2,240 | 17.5 | 53 |
| Lumpkin | 2,191 | 13.1 | 54 |
| Napanoch | 266 | 11.3 | 55 |