Criminal Immigration Convictions Drop 20 Percent
| Number Year-to-date | 42,778 |
|---|---|
| Percent Change from previous year | -12.6 |
| Percent Change from 2 years ago | -20.5 |
| Percent Change from 10 years ago | 121 |
| Percent Change from 20 years ago | 1144 |
The latest available data from the Justice Department show that during the first seven months of FY 2015 the government reported 42,778 new immigration convictions. If this activity continues at the same pace, the annual total of convictions will be 73,334 for this fiscal year. According to the case-by-case information analyzed by the Transactional Records Access Clearinghouse (TRAC), this is down from 83,874 convictions in FY 2014, and marks the second year in a row the number of criminal prosecutions for immigration offenses have declined. Overall, the pace of criminal convictions this year is 20 percent below the level during FY 2013 when such conviction numbers peaked at 92,215.
The comparisons of the number of defendants convicted for immigration-related offenses are based on case-by-case information obtained by TRAC under the Freedom of Information Act from the Executive Office for United States Attorneys.
The long term trend in immigration convictions going back to FY 1995 is shown more clearly in Figure 1. The vertical bars in Figure 1 represent the number of immigration convictions recorded each fiscal year. Projected figures for the current fiscal year are shown. Each presidential administration is distinguished by the color of the bars.
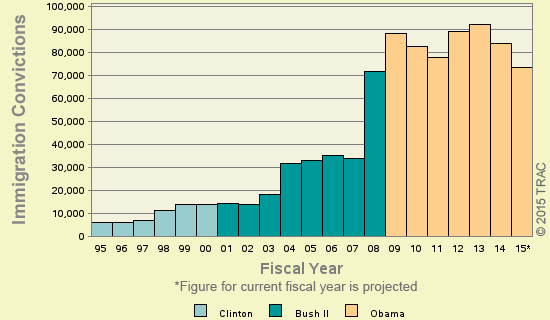
Figure 1. Criminal Immigration Convictions Over the Past Twenty Years
Despite the declines over the last two years, the Obama Administration continues to stand out as having drastically increased criminal prosecution for illegal entry and re-entry. During the first six years and seven months of the current administration, Justice Department data have recorded a total of 555,974 individuals have been convicted of immigration offenses. This compares with fewer than half that number — 251,952 — during the full eight years of the previous Bush Administration.
These increases took place during a period when the actual occurrence of immigration offenses were on the decline. For example, the Department of Homeland Security reports that in 2000, the number of noncitizens apprehended for immigration violations — chiefly illegal entry along the southwest border — were 1,387,486. This had steadily fallen to only 662,483 during FY 2013 (see DHS table).
Leading Investigative Agencies
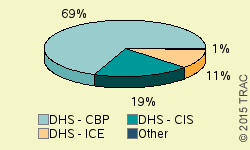
Figure 2. Convictions by
Investigative Agency
The lead investigative agency for immigration convictions through April 2015 was "Homeland Security — Customs and Border Protection" accounting for 68.8 percent of convictions.
As shown in Figure 2, additional agencies with substantial numbers of immigration convictions were: Homeland Security — Citizen and Immigration Services (19.2%), "Homeland Security — Immigration and Customs Enforcement" (11.1%).
Top Ranked Judicial Districts
Understandably, there is great variation in the number of immigration convictions in each of the nation's ninety-four federal judicial districts. The districts registering the largest number of convictions of this type during the first seven months of FY 2015 are shown in Table 2.
| Judicial District |
Count | Rank | 1yr ago |
5yrs ago |
10yrs ago |
20yrs ago |
|---|---|---|---|---|---|---|
| Texas, S | 15,438 | 1 | 1 | 2 | 1 | 2 |
| Arizona | 12,107 | 2 | 2 | 1 | 2 | 4 |
| Texas, W | 8,396 | 3 | 3 | 3 | 3 | 3 |
| N Mexico | 2,252 | 4 | 4 | 4 | 4 | 10 |
| Cal, S | 1,542 | 5 | 5 | 5 | 5 | 1 |
| Fla, S | 346 | 6 | 6 | 6 | 7 | 12 |
| Utah | 137 | 7 | 9 | 10 | 12 | 35 |
| Texas, N | 130 | 8 | 7 | 13 | 9 | 8 |
| Fla, M | 128 | 9 | 8 | 8 | 8 | 32 |
| N Dakota | 108 | 10 | 18 | 25 | 22 | 18 |
The Southern District of Texas (Houston) — with 15,438 convictions — was the most active through April 2015. The Southern District of Texas (Houston) was ranked first a year ago, while it was ranked second five years ago. The district's position ten years ago was first; twenty years ago it was second.
The District of Arizona ranked second. The District of Arizona was ranked second a year ago, while it was ranked first five years ago. The district's position ten years ago was second; twenty years ago it was fourth.
The Western District of Texas (San Antonio) now ranks third. The Western District of Texas (San Antonio) was ranked third a year ago as well as five years ago. The district's position was third ten as well as twenty years ago.
The federal judicial district which showed the greatest projected growth in immigration convictions compared to one year ago — 53.0 percent — was North Dakota. This was the same district that had the largest projected increase — 43.5 percent — when compared with five years ago.
In the last year, the judicial District Court recording the largest projected drop in immigration convictions — 22.2 percent — was the Western District of Texas (San Antonio).Ā