Immigration Detainers Decline 39 Percent Since FY 2012
Current as of March 2014
There has been a dramatic drop in the number of detainers issued by Immigration and Customs Enforcement (ICE), according to the latest available data from the agency. In the eighteen month period from the end of FY 2012 through March 2014, there has been a 39 percent decrease in the number of ICE detainers sent to local, state and federal law enforcement officials. This 39 percent decline translates into around 9,000 fewer ICE detainers issued each month, or more than 100,000 fewer a year.
Detainers, often called "immigration holds," have been a primary tool that ICE uses in order to detain and deport individuals it is seeking. These official ICE notices ask local, state and federal law enforcement agencies not to release suspected non-citizens held at their facilities in order to give ICE an opportunity to take them into its custody and initiate deportation steps.
| ICE Detainers Issued | ||
|---|---|---|
| FY 2012 | FY 2013 | FY 2014 |
| 273,982 | 213,325 | 69,492 |
| Ave. Monthly ICE Detainers Issued | ||
| FY 2012 | FY 2013 | FY 2014 |
| 22,832 | 17,777 | 13,898 |
| Percent Change | ||
| from FY 2012 to FY 2014 |
from FY 2012 to FY 2013 |
from FY 2013 to FY 2014 |
| -39% | -22% | -22% |
Here are the numbers. During FY 2012, as shown in Table 1, ICE issued over a quarter of a million detainers — an average of 22,832 detainers each month. This volume fell to a monthly average of 17,777 during FY 2013. The most recent data covering the five month period[1] ending in March 2014 reveal that the average monthly number of ICE detainers issued has now fallen to just 13,898. These results are based upon detainer-by-detainer records obtained from ICE by the Transactional Records Access Clearinghouse (TRAC) at Syracuse University under the Freedom of Information Act (FOIA).
Monthly figures are plotted in Figure 1. Setting aside minor month-to-month variation, the graph shows that the number of detainers ICE issued started to fall during September of 2012 and this decline has continued into 2014. Further, the rate of decline appears to have accelerated during the first half of FY 2014. (Note that records for October 2013 are unavailable.)
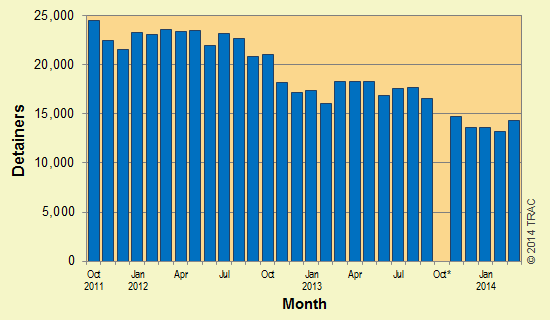
Figure 1. Number of ICE Detainers Issued
(*Records for October 2013 are not available. See detail table for figures.)
Detainers and Secure Communities
While the use of detainers can be documented going back for more than sixty years, historical information on the frequency of use of detainers is largely unavailable. We do know that Secure Communities (SC) greatly expanded ICE's ability to locate noncitizens who were not legally present in this country through the automated computerized matching of fingerprint records submitted by law enforcement officials with the agency's immigration records. Instead of focusing on removing individuals after they were convicted of serious crimes and serving prison terms, ICE's reach began to extend to anyone who was picked up and merely fingerprinted. By FY 2013 over eleven million fingerprint records were annually being screened by ICE through this program[2].
Despite the expansion of ICE's potential reach with the growth in coverage of Secure Communities, the limited data available do not show that detainer use appreciably changed. For example, the Congressional Research Service reports that detainers issued during FY 2009 — when few jurisdictions were covered by the SC program — were 270,988. This is about the same number that ICE records show in Table 1 for FY 2012[3]. FY 2009 does not seem to have been exceptional. TRAC's February 2013 report located ICE records for nearly a million detainers issued during the roughly four-year period from FY 2008 up to FY 2012.
However, the drop in ICE's use of detainers recorded during the first half of FY 2014 appears quite exceptional. Levels now are significantly lower than at any time since the Secure Communities program began.
What is Fueling the Current Decline in Detainer Use?
The reasons for the drop in ICE detainer use over the last year and a half are not entirely clear. TRAC shared its findings with ICE and asked the agency for insights into what was driving this downward trend. However, ICE declined to comment on why its agents were issuing fewer detainers.
Many factors could be at work. For example, ICE may be issuing fewer detainers because the agency had already located and deported many of the noncitizens who had committed serious crimes or were a threat to public safety, leaving fewer such individuals in the country left to deport. Hard data to confirm or refute this supposition, however, are unavailable[4].
On the other hand, ICE could be reacting in part to growing criticism of the Secure Communities program. Compliance with detainer requests was long considered mandatory. However, the agency recently acknowledged that compliance with ICE detainers is actually optional since detainers are simply requests and "they are not mandatory as a matter of law." (See letters to Congress dated February 25, 2014) Litigation over the legitimacy of ICE's use of detainers under SC has resulted in several recent court decisions along a similar vein, and also holding that honoring ICE detainers may violate an individuals' Fourth Amendment's rights and subject local jurisdictions to liability for false imprisonment[5]. The end result of all of these developments is that an increasing number of state and local jurisdictions no longer automatically comply with ICE detainers and are refusing to hold individuals arrested for minor violations or those whose release poses little risk to public safety. Thus, ICE may have cut back issuing detainers where it felt they would not be honored.
Changes in the agency's geographic focus no doubt also has had an impact on detainer trends. ICE reports that its removals are increasingly coming from apprehensions by Customs and Border Protection (CBP) officers. There is little need to use detainers when individuals apprehended at the border are directly turned over to ICE for detention and removal[6]. However, here it is difficult to disentangle whether the shift to greater border enforcement was a cause or consequence of the falling use of detainers. Whether the drop in ICE detainers was a cause or consequence of stepped up border removals[7], these two alternative pipelines together kept ICE detention beds filled in compliance with congressional mandates and fed the flow of ICE deportations.
Detainer Trends State-by-State
Declines in ICE detainer use occurred in almost every state. Running counter to these trends and ending the period with more rather than fewer ICE detainers were two states (Vermont and New Hampshire), the District of Columbia and the U.S. territory of Guam. The District of Columbia had the largest percentage increase — 53 percent, followed by Vermont (48%), Guam (39%), and New Hampshire (26%). Admittedly the actual number of detainers these increases represent were quite small. Thurs far during FY 2014, D.C. averaged 19 detainers a month, New Hampshire averaged 12 detainers per month, Guam had only 4 and Vermont just 2.
As shown in Table 2, New York with a total of over 20,000 detainers was the largest state that did not see any real decline in ICE detainer use. Between FY 2012 and FY 2013, the state actually saw an increase in ICE detainers. Then, during the first six months of FY 2014, detainers use fell back to around its 2012 levels.
At the opposite extreme, some areas of the country experienced particularly sharp declines. Comparing monthly detainer use during the first half of FY 2014 to monthly averages during FY 2012, Puerto Rico experienced more than twice the national decline — a drop of 86 percent compared to the national decline of 39 percent. Indiana, Connecticut, Kansas, and Delaware all experienced declines greater than 60 percent (see Table 2).
(Click column header to sort, click table title to open in new window)
| State | ICE Detainers Issued | Ave. Monthly ICE Detainers Issued | ||||||
|---|---|---|---|---|---|---|---|---|
| Total | FY 2012 |
FY 2013 |
FY 2014* |
FY 2012 |
FY 2013 |
FY 2014* |
Change from FY 2012 to FY 2014 |
|
| Total | 556,799 | 273,982 | 213,325 | 69,492 | 22,832 | 17,777 | 13,898 | -39% |
| California | 119,053 | 63,464 | 43,776 | 11,813 | 5,289 | 3,648 | 2,363 | -55% |
| Texas | 114,173 | 52,684 | 45,658 | 15,831 | 4,390 | 3,805 | 3,166 | -28% |
| Georgia | 29,685 | 16,142 | 10,693 | 2,850 | 1,345 | 891 | 570 | -58% |
| Arizona | 28,323 | 13,086 | 11,072 | 4,165 | 1,091 | 923 | 833 | -24% |
| Florida | 26,796 | 13,262 | 10,329 | 3,205 | 1,105 | 861 | 641 | -42% |
| New York | 20,175 | 8,202 | 8,620 | 3,353 | 684 | 718 | 671 | -2% |
| North Carolina | 14,823 | 7,924 | 5,345 | 1,554 | 660 | 445 | 311 | -53% |
| Virginia | 12,474 | 6,336 | 4,607 | 1,531 | 528 | 384 | 306 | -42% |
| Colorado | 11,985 | 5,480 | 5,227 | 1,278 | 457 | 436 | 256 | -44% |
| Washington | 10,853 | 4,784 | 4,572 | 1,497 | 399 | 381 | 299 | -25% |
| Illinois | 10,210 | 5,116 | 3,962 | 1,132 | 426 | 330 | 226 | -47% |
| Pennsylvania | 9,609 | 4,167 | 4,178 | 1,264 | 347 | 348 | 253 | -27% |
| New Jersey | 8,222 | 3,977 | 3,231 | 1,014 | 331 | 269 | 203 | -39% |
| Ohio | 8,113 | 3,769 | 3,267 | 1,077 | 314 | 272 | 215 | -31% |
| Oregon | 7,975 | 3,973 | 2,966 | 1,036 | 331 | 247 | 207 | -37% |
| Tennessee | 7,844 | 4,112 | 2,875 | 857 | 343 | 240 | 171 | -50% |
| Oklahoma | 6,925 | 3,593 | 2,507 | 825 | 299 | 209 | 165 | -45% |
| Minnesota | 6,614 | 3,400 | 2,545 | 669 | 283 | 212 | 134 | -53% |
| South Carolina | 6,308 | 3,437 | 2,133 | 738 | 286 | 178 | 148 | -48% |
| Nevada | 5,439 | 2,819 | 1,956 | 664 | 235 | 163 | 133 | -43% |
| Maryland | 5,312 | 2,723 | 1,985 | 604 | 227 | 165 | 121 | -47% |
| Indiana | 4,678 | 2,755 | 1,562 | 361 | 230 | 130 | 72 | -69% |
| Louisiana | 4,359 | 2,186 | 1,715 | 458 | 182 | 143 | 92 | -50% |
| Utah | 4,325 | 2,174 | 1,596 | 555 | 181 | 133 | 111 | -39% |
| Alabama | 4,237 | 2,196 | 1,459 | 582 | 183 | 122 | 116 | -36% |
| New Mexico | 4,173 | 2,000 | 1,566 | 607 | 167 | 131 | 121 | -27% |
| Mississippi | 3,920 | 1,740 | 1,651 | 529 | 145 | 138 | 106 | -27% |
| Nebraska | 3,799 | 1,782 | 1,557 | 460 | 149 | 130 | 92 | -38% |
| Iowa | 3,706 | 1,904 | 1,362 | 440 | 159 | 114 | 88 | -45% |
| Kansas | 3,683 | 2,170 | 1,178 | 335 | 181 | 98 | 67 | -63% |
| Arkansas | 3,649 | 1,953 | 1,278 | 418 | 163 | 107 | 84 | -49% |
| Michigan | 2,950 | 1,641 | 987 | 322 | 137 | 82 | 64 | -53% |
| Kentucky | 2,797 | 1,417 | 1,131 | 249 | 118 | 94 | 50 | -58% |
| Wisconsin | 2,596 | 1,173 | 1,001 | 422 | 98 | 83 | 84 | -14% |
| Missouri | 2,287 | 1,291 | 776 | 220 | 108 | 65 | 44 | -59% |
| Massachusetts | 2,209 | 1,131 | 766 | 312 | 94 | 64 | 62 | -34% |
| Idaho | 2,080 | 937 | 817 | 326 | 78 | 68 | 65 | -16% |
| Connecticut | 1,662 | 926 | 605 | 131 | 77 | 50 | 26 | -66% |
| Wyoming | 843 | 435 | 312 | 96 | 36 | 26 | 19 | -47% |
| South Dakota | 829 | 435 | 292 | 102 | 36 | 24 | 20 | -44% |
| West Virginia | 818 | 476 | 261 | 81 | 40 | 22 | 16 | -59% |
| Delaware | 662 | 362 | 244 | 56 | 30 | 20 | 11 | -63% |
| District of Columbia | 467 | 149 | 223 | 95 | 12 | 19 | 19 | 53% |
| Hawaii | 428 | 229 | 125 | 74 | 19 | 10 | 15 | -22% |
| Rhode Island | 349 | 183 | 128 | 38 | 15 | 11 | 8 | -50% |
| New Hampshire | 347 | 150 | 118 | 79 | 13 | 10 | 16 | 26% |
| Puerto Rico | 343 | 205 | 126 | 12 | 17 | 11 | 2 | -86% |
| North Dakota | 248 | 106 | 105 | 37 | 9 | 9 | 7 | -16% |
| Alaska | 155 | 67 | 67 | 21 | 6 | 6 | 4 | -25% |
| Guam | 123 | 38 | 63 | 22 | 3 | 5 | 4 | 39% |
| Maine | 119 | 60 | 44 | 15 | 5 | 4 | 3 | -40% |
| Montana | 68 | 38 | 22 | 8 | 3 | 2 | 2 | -49% |
| Virgin Islands | 68 | 22 | 39 | 7 | 2 | 3 | 1 | -24% |
| Northern Mariana Isl | 59 | 30 | 17 | 12 | 3 | 1 | 2 | -4% |
| Vermont | 31 | 13 | 10 | 8 | 1 | 1 | 2 | 48% |
| Not Recorded | 22,821 | 9,158 | 8,618 | 5,045 | 763 | 718 | 1,009 | 32% |
In terms of sheer numbers, two states — California and Texas — stood head and shoulders above all others. Indeed, these two states accounted for 42 percent of all detainers ICE issued during this time period. Because so much of ICE detainer activity takes place within their borders, California and Texas have an outsize impact on the national picture. And both states experienced declines.
However the pattern of their declines differed. At the beginning of the period, California received a much larger number of ICE detainers than Texas. However, the sharper declines in California resulted in Texas ending the period as the state receiving the most ICE detainers. Indeed for part of this period Texas actually experienced a growth in the number of ICE detainers it saw. (See Figure 2 and accompanying detail table. Note the break in the two lines occurs because ICE has not released detainer data for October 2013.)
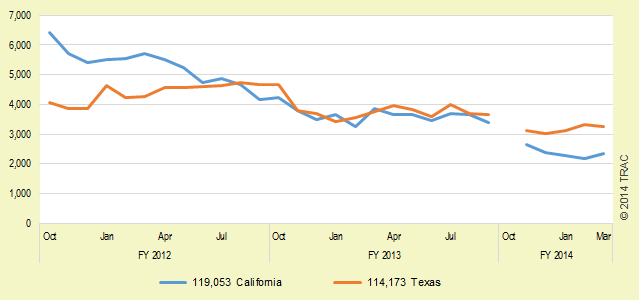
Figure 2. Number of ICE Detainers Issued by Month in California and Texas
(Records for October 2013 are not available. See detail table for figures.)
In addition to California and Texas, nine other states received more than 10,000 ICE detainers. Together these nine states plus California and Texas accounted for over seven out of ten detainers (72%) issued by ICE.
Figure 3 plots the month-by-month trends in ICE detainers for each of these nine states. Except for New York, the declining trends in ICE detainer use appear surprisingly similar across these states. The plot shows clustering into two groups. The first group with consistently more ICE detainers are Georgia, Arizona, and Florida. While the rate of decline varied from a high of 58 percent in Georgia to a low of 24 percent in Arizona, the trend lines still tend to cluster together for at least the last year.
The second group of states with consistently lower detainer numbers are North Carolina, Virginia, Colorado, Washington, and Illinois. While generally trend lines for these clustered together, North Carolina's numbers dropped by 53 percent while Washington's fell by just 25 percent.
The remaining state, New York, stands out as having a quite different trend from the others. It started out in this second group, but ended up as part of the first group composed of states that received relatively greater numbers of ICE detainers.
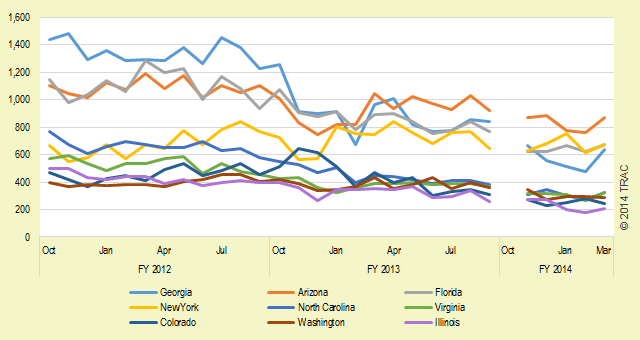
Figure 3. Number of ICE Detainers Issued by Month in Other States
with More Than 10,000 Detainers
(Records for October 2013 are not available. See detail table for figures.)
Trends by Individual Jail, Prison or other Detention Facility
ICE detainers were issued to over 4,000 individual jails, prisons and other detention facilities during this period. Patterns in these were quite diverse. Just because a particular state had a lower level of detainer activity, it was not necessarily true that all facilities within the state also showed declines. This is not surprising: policies as to where prisoners are housed can change, as can the needs for detention in a particular locale. Thus, specific jail and prison populations can shift over time. As a natural consequence, if a jail population drops it would be expected that fewer detainers would be issued, whereas with more prisoners a greater number of detainers might be expected.
Individual facilities within a state could also experience differences because of particular changes in policy with respect to the handling of ICE detainers within that jurisdiction. A number of cities and counties during this period, for example, changed their policies with respect to honoring ICE detainers.
Thus, it was not uncommon for some facilities within a state to show an increase in the number of ICE detainers while other facilities showed declines. For example, while California as a whole experienced an above average drop in the number of ICE detainers over this period, the Taft Federal Correctional Institution saw a 21.8 percent increase. And in New York State, while there was little change in the number of ICE detainers issued overall, Rikers Island in Queens — which received the most ICE detainers in New York, nearly 4,000 — experienced a 25.1 percent drop in volume during this period, while Queens Central Booking, Brooklyn Central Booking, Manhattan Central Booking, and Bronx Central Booking all saw increases on the order of 300 to over 400 percent.
Appendix Table 3 provides details on detainers issued by ICE to each of these over 4,000 facilities.
Ongoing Research
This report focused exclusively on trends, and does not examine the characteristics of individuals who were subject to detainers. TRAC is currently analyzing the criminal records of individuals in the data it received, and will be reporting on these findings when this research is complete.
Footnotes
[1] Data from ICE covering October 2013 — requested under FOIA over a year ago — has still not been furnished.
[2] Because more than one fingerprint record can be received for the same individual, this figure overstates the number of persons who were screened.
[3] These figures are based on the number of ICE detainers issued. ICE data does not indicate how many of these were or were not honored by local authorities.
[4] Programs focusing on non-citizens convicted of crimes have long existed within all federal and state prisons, and now cover a substantial number of noncitizens serving sentences in many municipal facilities. Here detainers are issued so that individuals after serving their time are released to ICE rather than back into the community. Indeed, government statistics show that in FY 2011 there were over 100,000 non-citizens serving time in federal and state prisons, not counting those who are serving their sentences in municipal or county facilities. Unfortunately data tracking trends in the number of noncitizens released from prison are not available.
[5] See Miranda-Olivares v. Clackamas County, No. 3:12-cv-02317-ST, Oregon USDC, April 11, 2014 finding a violation of the Fourth Amendment where because of an ICE detainer a county denied an alien release on bail for which she was otherwise qualified. Further, the Third Circuit in Galarza v. Szalczyk, No. 12-3991, ruled March 4, 2014 "that immigration detainers do not and cannot compel a state or local law enforcement agency to detain suspected aliens subject to removal."
[6] ICE reported that removals resulting from sources other than CBP declined from 180,970 during FY 2012 to only 133,551 in FY 2013 — a decline of 26 percent. During this same period the decline in issuance of ICE detainers was 22 percent. Source: ERO Annual Report, FY 2013 ICE Immigration Removals.
[7] Unlike Mexicans caught by the Border Patrol who can be quickly sent back home, the process for removing Central Americans typically takes more time so that these individuals are turned over to ICE for temporary detention and thus end up being counted by ICE as part of its removals.