Despite Rise in Felony Charges, |
Illegal Entry or Re-entry
| Fiscal Year | Immigration Cases | Illegal Entry (8 USC 1325) | Illegal Re-entry (8 USC 1326) |
|---|---|---|---|
| 2004 | 31,547 | 18,375 | 9,044 |
| 2005 | 33,178 | 17,721 | 10,409 |
| 2006 | 35,160 | 17,876 | 11,953 |
| 2007 | 33,740 | 16,786 | 11,372 |
| 2008 | 71,587 | 49,808 | 14,911 |
| 2009 | 88,065 | 62,047 | 19,372 |
| 2010 | 82,437 | 54,495 | 21,916 |
| 2011 | 77,697 | 49,085 | 23,186 |
| 2012 | 88,908 | 61,382 | 22,342 |
| 2013 | 92,215 | 68,026 | 19,898 |
| 2014* | 36,256 | 24,647 | 9,716 |
Convictions for the petty offense of illegal entry (8 USC 1325) continue to dominate the criminal enforcement of federal immigration laws. During the first six months of fiscal year 2014, according to the case-by-case government records analyzed by the Transactional Records Access Clearinghouse (TRAC), two out of three immigration convictions — 24,647 out of a total of 36,256 criminal convictions — were for this offense. This ratio is little changed from the pattern of the last decade, which is striking given a recent surge in the number of people charged with felony illegal re-entry (8 USC 1326). While there was some year-to-year variation during the previous 10 year period from FY 2004-FY 2013, overall 65 percent of all immigration convictions were for illegal entry. During the first six months of the current fiscal year, 68 percent were convictions for the petty offense of illegal entry, which is punishable by up to six months in jail.
Only around one out of every four immigration convictions have been for the more serious charge of illegal re-entry (8 USC 1326), a felony. During the first six months of FY 2014, 9,716 out of the total of 36,256 immigration convictions were for illegal re-entry — or 27 percent. This is little changed from the average of 26 percent during the previous 10 years. See Table 1 for actual numbers. Figure 1 displays illegal entry versus illegal re-entry convictions year-by-year.
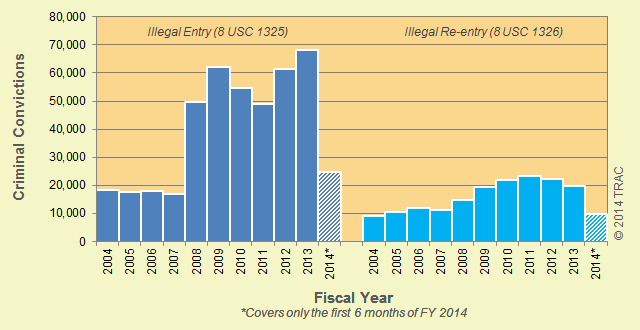
Figure 1. Criminal Convictions for Illegal Entry or Re-entry
The picture that emerges from examining convictions is quite different from the one documented in TRAC's May 13, 2014 report covering the same period but focusing on the offenses with which noncitizens were being charged rather than convicted. As reported there, during the first six months of FY 2014 prosecutions for illegal re-entry surpassed the number for illegal entry. TRAC's latest analysis, however, shows that the illegal re-entry charge is increasingly pled down to the lesser illegal entry charge, so that the increase in felony charges has not lead to an increase in felony convictions.
The remainder of this report focuses on the dynamics of charging illegal re-entry more often, while seeing little, if any, change in actual convictions for this offense.
Plea Bargaining and Immigration Offenses
of Illegal Re-entry*
| Fiscal Year |
Charged Illegal Re-entry and Convicted of: | |||
|---|---|---|---|---|
| Illegal Re-entry | Illegal Entry | |||
| Number | Percent | Number | Percent | |
| 2004 | 9,044 | 84% | 1,760 | 16% |
| 2005 | 10,409 | 85% | 1,767 | 15% |
| 2006 | 11,953 | 76% | 3,709 | 24% |
| 2007 | 11,372 | 73% | 4,133 | 27% |
| 2008 | 14,911 | 73% | 5,625 | 27% |
| 2009 | 19,372 | 75% | 6,593 | 25% |
| 2010 | 21,916 | 67% | 10,834 | 33% |
| 2011 | 23,186 | 68% | 10,806 | 32% |
| 2012 | 22,342 | 61% | 14,241 | 39% |
| 2013 | 19,898 | 57% | 15,012 | 43% |
| 2014** | 9,716 | 51% | 9,179 | 49% |
Almost all individuals charged with a criminal federal offense end up convicted. For all federal prosecutions completed during the first six months of fiscal 2014 — from drug offenses to white collar violations, etc. — 91 percent ended with a conviction of one type or another, according to the TRAC analysis. For that subset of individuals criminally charged with immigration offenses, 97 percent ended up convicted, according to TRAC's analysis of Department of Justice data.
Further, very few individuals insist on going through a trial to determine guilt or innocence. For example, in cases where illegal re-entry was the lead charge, 99.8 percent of those convicted pled guilty without going to trial. As an incentive for pleading guilty, the prosecutor can agree to reduce the charge and hence the potential sentence. For example, the prosecutor may charge a non-citizen with illegal re-entry, but be willing to reduce the charge to illegal entry in exchange for a guilty plea.
Figure 2 shows year-by-year numbers for the outcome of those charged with illegal re-entry, and whether the conviction that resulted was for the felony offense of illegal re-entry versus the petty misdemeanor of illegal entry. A decade ago, 84 percent of those charged with illegal re-entry were convicted of that offense. Only 16 percent of the cases pled down to simple illegal entry. Five years ago, the percentages were 75 percent convicted of illegal re-entry versus 25 percent pled down to illegal entry. This percentage has continued to fall. In fact, during the first six months of this fiscal year, only half (51%) of those charged with illegal re-entry ended up convicted of that offense. The other half pled down to the petty offense of illegal entry.
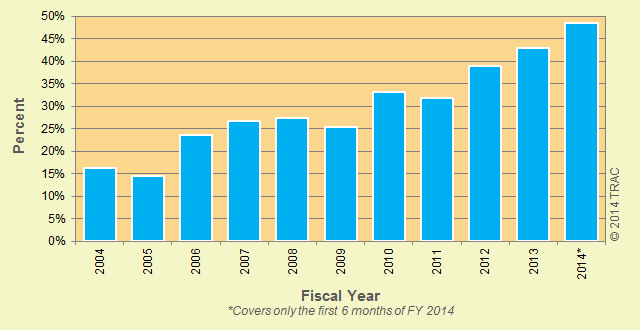
Figure 2. Charged with Illegal Re-entry and Convicted of Misdemeanor Illegal Entry
District Practices Differ
| District | Charged with Illegal Re-entry and Convicted of: |
|||
|---|---|---|---|---|
| Illegal Re-entry | Illegal Entry | |||
| Number | Percent | Number | Percent | |
| SW Border Subtotal | 21,683 | 47% | 24,144 | 53% |
| Arizona | 3,010 | 11% | 23,266 | 89% |
| California South | 2,576 | 81% | 623 | 19% |
| New Mexico | 4,338 | 98% | 106 | 2% |
| Texas South | 5,768 | 99% | 38 | 1% |
| Texas West | 5,991 | 98% | 111 | 2% |
| Rest of U.S. | 7,931 | 99% | 47 | 1% |
The national figures show that prosecutors who charge an individual with illegal re-entry are currently willing about half the time to accept a plea of guilty to simple illegal entry. However, an individual charged with illegal re-entry doesn't have a 50-50 chance of being able to plead down to illegal entry. Rather, this figure reflects an average across offices with quite different policies, so the actual odds for any individual depend on where he or she is apprehended. Some offices rarely accept such a plea bargain, while in others this is the rule rather than the exception.
In fact, as shown in Table 3, plea bargains of this type are rare in all but two federal judicial districts: Arizona and the Southern District of California. In the remaining districts along the southwest border — New Mexico, the Western District of Texas, and Texas's Southern District — virtually everyone charged with illegal re-entry is also convicted of that offense. Similarly, in districts outside the southwest border, 99 percent of those charged with illegal re-entry are convicted of that charge.
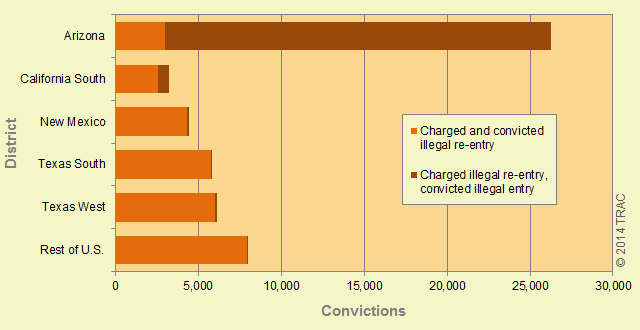
Figure 3. Outcomes for Original Charge of Illegal Re-entry
by District (October 2012 - March 2014)*
(*Excludes some cases where the conviction was for some other offense, the defendant
was found not guilty, or charges against the defendant were dismissed.)
Yet in Arizona, nine out of every ten (89%) individuals charged with illegal re-entry during the last 18 months were allowed to plea down to the petty misdemeanor of simple illegal entry. In the Southern District of California during the same period, such plea bargains were accepted 19 percent of the time.
Practices in Arizona and Southern California have not always been this way. Looking at the Arizona figures over time, for example, there has been a sharp rise in the number of individuals charged with illegal re-entry along with the acceptance of these plea bargains. In the end, this has resulted in very little change in the number of individuals actually convicted of illegal re-entry. See Figure 4 (for details, see Appendix Table 4).
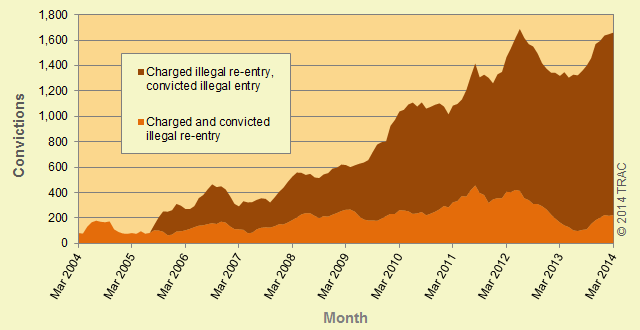
Figure 4. Outcomes for Original Charge of Illegal Re-entry in Arizona
over Time (March 2004 - March 2014)
In addition to differences among districts and over time, there are significant variations in charging and plea bargaining practices among offices within the same district. These contrasting practices often reflect how different prosecutors along the southwest border have implemented the Department of Homeland Security's Project Streamline to criminally prosecute those apprehended illegally entering this country.
The next report in this series will examine in greater detail the charging and plea bargaining practices both within and between adjacent districts along the southwest border, as well as what impact these practices appear to have on conviction rates.
Appendix
(Click table title to open in new window)
| Month | Charged Illegal Re-entry and Convicted of: | |||
|---|---|---|---|---|
| Illegal Re-entry | Illegal Entry | |||
| Number | Percent | Number | Percent | |
| Mar 2004 | 83 | 100% | 0 | 0% |
| Apr 2004 | 78 | 100% | 0 | 0% |
| May 2004 | 134 | 100% | 0 | 0% |
| Jun 2004 | 168 | 100% | 0 | 0% |
| Jul 2004 | 180 | 100% | 0 | 0% |
| Aug 2004 | 171 | 100% | 0 | 0% |
| Sep 2004 | 168 | 100% | 0 | 0% |
| Oct 2004 | 174 | 100% | 0 | 0% |
| Nov 2004 | 112 | 100% | 0 | 0% |
| Dec 2004 | 91 | 100% | 0 | 0% |
| Jan 2005 | 79 | 100% | 0 | 0% |
| Feb 2005 | 77 | 100% | 0 | 0% |
| Mar 2005 | 83 | 100% | 0 | 0% |
| Apr 2005 | 76 | 100% | 0 | 0% |
| May 2005 | 96 | 99% | 1 | 1% |
| Jun 2005 | 77 | 99% | 1 | 1% |
| Jul 2005 | 83 | 99% | 1 | 1% |
| Aug 2005 | 104 | 71% | 42 | 29% |
| Sep 2005 | 103 | 50% | 104 | 50% |
| Oct 2005 | 93 | 37% | 160 | 63% |
| Nov 2005 | 65 | 26% | 186 | 74% |
| Dec 2005 | 70 | 27% | 192 | 73% |
| Jan 2006 | 95 | 30% | 217 | 70% |
| Feb 2006 | 96 | 32% | 202 | 68% |
| Mar 2006 | 104 | 38% | 168 | 62% |
| Apr 2006 | 115 | 42% | 156 | 58% |
| May 2006 | 129 | 44% | 166 | 56% |
| Jun 2006 | 141 | 39% | 217 | 61% |
| Jul 2006 | 144 | 38% | 239 | 62% |
| Aug 2006 | 153 | 36% | 274 | 64% |
| Sep 2006 | 160 | 34% | 306 | 66% |
| Oct 2006 | 154 | 35% | 291 | 65% |
| Nov 2006 | 172 | 38% | 278 | 62% |
| Dec 2006 | 165 | 39% | 262 | 61% |
| Jan 2007 | 135 | 36% | 239 | 64% |
| Feb 2007 | 113 | 36% | 199 | 64% |
| Mar 2007 | 112 | 38% | 181 | 62% |
| Apr 2007 | 108 | 33% | 225 | 67% |
| May 2007 | 81 | 25% | 243 | 75% |
| Jun 2007 | 86 | 26% | 241 | 74% |
| Jul 2007 | 112 | 33% | 232 | 67% |
| Aug 2007 | 124 | 35% | 232 | 65% |
| Sep 2007 | 128 | 36% | 224 | 64% |
| Oct 2007 | 126 | 39% | 198 | 61% |
| Nov 2007 | 136 | 38% | 227 | 62% |
| Dec 2007 | 152 | 37% | 255 | 63% |
| Jan 2008 | 150 | 34% | 290 | 66% |
| Feb 2008 | 166 | 34% | 321 | 66% |
| Mar 2008 | 185 | 35% | 343 | 65% |
| Apr 2008 | 205 | 37% | 354 | 63% |
| May 2008 | 229 | 41% | 327 | 59% |
| Jun 2008 | 239 | 44% | 301 | 56% |
| Jul 2008 | 238 | 43% | 310 | 57% |
| Aug 2008 | 217 | 42% | 303 | 58% |
| Sep 2008 | 201 | 39% | 315 | 61% |
| Oct 2008 | 215 | 40% | 329 | 60% |
| Nov 2008 | 212 | 38% | 343 | 62% |
| Dec 2008 | 227 | 39% | 363 | 61% |
| Jan 2009 | 240 | 40% | 357 | 60% |
| Feb 2009 | 256 | 41% | 366 | 59% |
| Mar 2009 | 266 | 43% | 352 | 57% |
| Apr 2009 | 267 | 44% | 334 | 56% |
| May 2009 | 250 | 41% | 366 | 59% |
| Jun 2009 | 213 | 34% | 415 | 66% |
| Jul 2009 | 189 | 30% | 449 | 70% |
| Aug 2009 | 182 | 28% | 474 | 72% |
| Sep 2009 | 182 | 25% | 538 | 75% |
| Oct 2009 | 179 | 23% | 600 | 77% |
| Nov 2009 | 196 | 25% | 601 | 75% |
| Dec 2009 | 216 | 27% | 588 | 73% |
| Jan 2010 | 234 | 25% | 693 | 75% |
| Feb 2010 | 233 | 24% | 741 | 76% |
| Mar 2010 | 263 | 25% | 777 | 75% |
| Apr 2010 | 260 | 25% | 792 | 75% |
| May 2010 | 254 | 23% | 840 | 77% |
| Jun 2010 | 233 | 21% | 876 | 79% |
| Jul 2010 | 237 | 22% | 841 | 78% |
| Aug 2010 | 248 | 22% | 863 | 78% |
| Sep 2010 | 222 | 21% | 839 | 79% |
| Oct 2010 | 235 | 22% | 841 | 78% |
| Nov 2010 | 251 | 23% | 842 | 77% |
| Dec 2010 | 270 | 24% | 834 | 76% |
| Jan 2011 | 296 | 27% | 782 | 73% |
| Feb 2011 | 284 | 28% | 733 | 72% |
| Mar 2011 | 325 | 30% | 761 | 70% |
| Apr 2011 | 334 | 30% | 764 | 70% |
| May 2011 | 374 | 33% | 759 | 67% |
| Jun 2011 | 369 | 31% | 838 | 69% |
| Jul 2011 | 420 | 32% | 896 | 68% |
| Aug 2011 | 457 | 32% | 961 | 68% |
| Sep 2011 | 399 | 30% | 909 | 70% |
| Oct 2011 | 382 | 29% | 947 | 71% |
| Nov 2011 | 319 | 24% | 985 | 76% |
| Dec 2011 | 348 | 28% | 913 | 72% |
| Jan 2012 | 357 | 27% | 975 | 73% |
| Feb 2012 | 356 | 26% | 995 | 74% |
| Mar 2012 | 407 | 28% | 1,058 | 72% |
| Apr 2012 | 404 | 26% | 1,132 | 74% |
| May 2012 | 422 | 26% | 1,194 | 74% |
| Jun 2012 | 415 | 25% | 1,274 | 75% |
| Jul 2012 | 356 | 22% | 1,262 | 78% |
| Aug 2012 | 342 | 22% | 1,227 | 78% |
| Sep 2012 | 311 | 20% | 1,240 | 80% |
| Oct 2012 | 311 | 21% | 1,185 | 79% |
| Nov 2012 | 294 | 21% | 1,125 | 79% |
| Dec 2012 | 268 | 19% | 1,107 | 81% |
| Jan 2013 | 229 | 17% | 1,116 | 83% |
| Feb 2013 | 195 | 15% | 1,148 | 85% |
| Mar 2013 | 166 | 13% | 1,153 | 87% |
| Apr 2013 | 143 | 11% | 1,206 | 89% |
| May 2013 | 129 | 10% | 1,176 | 90% |
| Jun 2013 | 104 | 8% | 1,225 | 92% |
| Jul 2013 | 99 | 7% | 1,225 | 93% |
| Aug 2013 | 107 | 8% | 1,251 | 92% |
| Sep 2013 | 112 | 8% | 1,288 | 92% |
| Oct 2013 | 154 | 11% | 1,305 | 89% |
| Nov 2013 | 183 | 12% | 1,387 | 88% |
| Dec 2013 | 204 | 13% | 1,391 | 87% |
| Jan 2014 | 225 | 14% | 1,413 | 86% |
| Feb 2014 | 218 | 13% | 1,429 | 87% |
| Mar 2014 | 224 | 14% | 1,436 | 86% |