Transfers of ICE Detainees from the
Rapp Sec Center
Stafford, Virginia
Detainees Transferred Number last 12 months 309 Out of total detained 364 Facility ranking on transfers top 36 %
Table 1: TransfersDuring the most recent 12 month period for which data are available, a total of 309 detainees were transferred by Immigration and Customs Enforcement (ICE) from the Rapp Sec Center where they had been temporarily housed to other facilities. The average stay for these individuals before their transfer was 61 days. The use of this facility for the temporary housing of federal immigration detainees was arranged through an intergovernmental service agreement (IGSA) under which payments by ICE to another governmental agency are made for housing federal detainees. Additional information about the arrangement, including whether a private company may operate the facility for the government, was not available at the time this report was posted.
Transfers made up 85 percent of the 364 detainees who in one way or another left this facility during the last 12 months. This report focuses just on these transfers. The remaining individuals who departed from the Rapp Sec Center last year actually left ICE detention. These individuals were deported from the country, released under supervision while their cases was being decided, or left ICE detention for a variety of other reasons. For more information on this facility please see additional TRAC reports in this series.
This report series is based upon analyses conducted by the Transactional Records Access Clearinghouse (TRAC) at Syracuse University of 1.7 million government records tracking each individual who passed through an ICE detention facility during fiscal year 2015. This most recent 12 month period for which comprehensive data are available covers October 2014 through September 2015. See About the Data.
How This Facility Ranks Nationally
Detainee transfer rankings. The Rapp Sec Center was one of 637 facilities nationwide that housed ICE detainees during the most recent 12 month period. Of these 637, there were 409 facilities that had at least 10 ICE detainee transfers last year. Excluding those facilities with fewer than 10 transfers, the Rapp Sec Center last year ranked in the top 36 percent nationwide in the number of individuals it transferred to other ICE facilities. This means that 36 percent of the locations contributed the same or a larger numbers of transfers, while 64 percent had a smaller number. See Table 1.
Average length of stay before transfer. Once detainees arrived at the Rapp Sec Center their average length of stay before being transferred on to another ICE facility was 61 days last year. Ranking facilities from longest to shortest detention stays for their transfer population, this average of 61 days placed Rapp Sec Center in the top 10 percent of all facilities nationwide. That is, for detainees who are transferred, 10 percent of ICE detention facilities have the same or longer average stays last year, while 90 percent of detention facilities had shorter average stays.
Origins and Destinations
Were these detainees arrested locally? Where did those that ended up being transferred from the Rapp Sec Center last year originate? Information on the place of arrest was not included in the available data ICE released. However, we can examine whether the Rapp Sec Center was the first ICE facility in which these detainees were held. According to ICE records, for some (13 percent) of these detainees, the Rapp Sec Center was the first place they were sent when they were detained by ICE. The remaining 87 percent had been transferred in from another ICE detention facility.
We can also look at how quickly they arrived at this facility after they were first detained. A total of 77 percent arrived at the Rapp Sec Center at some point during the very first day they were detained by ICE. This percentage is also based on an analysis of the most recent 12 months for which data are available.
How soon did transfers occur? Nationally, the median number of days before an ICE detainee is transferred to another facility was 1 days last year. That means that half of all transfers occurred on or before the 1st day, while half had longer stays before they were transferred on to another ICE facility. Note that nationally the average stay at an ICE detention facility before an individual is transferred is longer - 12 days. This is because while most detainees have relatively short stays before ICE transfers them elsewhere, sometimes stays are lengthy and these lengthy stays raise the average to above the median stay.
For the Rapp Sec Center last year, the median stay before a detainee was transferred was 27 days. This is much longer than the national figure. The average stay before transfers occurred was longer - 61 days - than the median stay. As noted above, this figure placed the facility in the top 10 percent among ICE detention facilities nationwide in the average number of days a detainee spent before he or she was transferred.
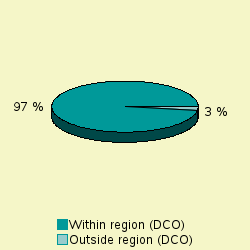
Where did those transferred get sent? ICE currently has great discretion about where in the United States transferred detainees are sent. For the period covered by these data, ICE divided the country into geographic regions or areas and assigned each to one of 152 document control offices or DCOs for the purpose of keeping track of detainees. Available data allow us to examine whether the transfer occurred within the same DCO or the transfer was to a different DCO. For the nation as a whole during the latest 12 months, 54 percent were within the same DCO, while the remaining 46 percent were to a different DCO.
Transfers Facility Profile U.S Overall
Profile (%)Number Percent Within region (DCO) 354 97% 54% Outside region (DCO) 10 2.7% 46% Total 364 100% 100%
Table 3: Transfer destinations during last 12 months
Figure 2 and accompanying Table 3 provide some comparative figures for how the Rapp Sec Center stacks up against this national pattern. Last year, 97 percent of the transfers from the Rapp Sec Center were to locations in the same region -- facilities under the control of same ICE docket control office. Only a few of the transfers went to detention facilities in a different region (DCO).
Nationalities
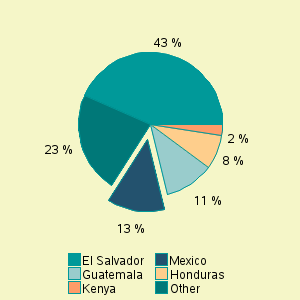
Which nationalities predominate? Last year in the United States, individuals from Mexico comprised the largest number of those transferred by ICE. Some 41.3 percent of all transfers recorded Mexico as their country of origin. The Rapp Sec Center had a much smaller proportion of detainees from Mexico - 13 percent - among their transfers. Detainees from Mexico were not the largest single nationality group among the transfers at the facility.
In descending order, the top nationalities that made up transfers from the Rapp Sec Center last year were: El Salvador (43%) , Mexico (13%), Guatemala (11%), Honduras (8%) and Kenya (2%).
For the frequency for each of the nationalities within the top 10 among transfers from the Rapp Sec Center last year see Table 4.
Nationalities Ranked in Top 10 Transfers Total To Diff. DCO % Diff DCO - ALL 364 10 2.7 % 1 El Salvador 158 3 1.9 % 2 Mexico 47 1 2.1 % 3 Guatemala 40 1 2.5 % 4 Honduras 28 1 3.6 % 5 Kenya 9 0 0.0 % 6 Cameroon 5 0 0.0 % Dominican Republic 5 0 0.0 % Peru 5 0 0.0 % Sierra Leone 5 0 0.0 % 10 Argentina 3 1 33.3 % Bangladesh 3 0 0.0 % Egypt 3 0 0.0 % Ethiopia 3 0 0.0 % Morocco 3 0 0.0 %
Table 4: Transfers by nationality
during the last 12 months
Out-of-region transfers by nationality. Within the nationalities that made up those listed in Table 4, the proportion transferred out of the region varied from 0 percent to 33 percent. As mentioned above, on average 3 percent of detainees transferred from the Rapp Sec Center were sent to detention locations outside the region.
For Argentina with a total of 3 transfers, 33 percent of transfers were out-of-region transfers. More than one country was tied with the lowest out-of-region transfer rates (see Table 4).