Detainees Leaving ICE Detention from the
Howard County Detention Center
Jessup, Maryland
Detainees Deported or Released Number last 12 months 139 Out of total detained 239 Facility ranking on detainees top 48 %
Table 1: Number leaving ICE detention
from this facilityDuring the most recent 12 month period for which data are available, a total of 139 detainees housed at the Howard County Detention Center left that facility because they were deported, were released under supervision while their cases were being decided, or left ICE detention for one of a variety of other reasons. The use of this facility for the temporary housing of federal immigration detainees was arranged through an intergovernmental service agreement (IGSA) under which payments by ICE to another governmental agency are made for housing federal detainees. Additional information about the arrangement, including whether a private company may operate the facility for the government, was not available at the time this report was posted.
Those individuals who departed from this facility because they were leaving ICE detention made up 58 percent of the 239 detainees housed at this facility during the last 12 months. This report focuses on the reasons these individuals left ICE detention. Sometimes this report speaks of these individuals as those "exiting" ICE detention, or simply as "exits." The others remained in ICE detention but were transferred from the Howard County Detention Center to other facilities.
This report covers those who left ICE custody. It excludes individuals transferred to other ICE facilities. For more information on this facility, including individuals that were transferred, see additional TRAC reports in this series.
This report series is based upon analyses conducted by the Transactional Records Access Clearinghouse (TRAC) at Syracuse University of 1.7 million government records tracking each individual who passed through an ICE detention facility during fiscal year 2015. This most recent 12 month period for which comprehensive data are available covers October 2014 through September 2015. See About the Data.
How This Facility Ranks Nationally
Rankings on the number leaving ICE detention. The Howard County Detention Center was one of 637 facilities nationwide that housed ICE detainees during the most recent 12 month period. Of these 637, there were 358 that had at least 10 individuals who were deported or released. Excluding those facilities with fewer than 10 exits, the Howard County Detention Center last year ranked in the top 48 percent nationwide in the number of individuals leaving ICE detention. This means that 48 percent of the locations contributed the same or a larger numbers of exits, while 52 percent had a smaller number. See Table 1.
Deportations. Nationally, the most common reason that a detainee left ICE detention was that they were deported from the United States. During the most recent 12 month period for which comprehensive data are available, nationwide 56.3 percent of those leaving ICE detention were deported or "voluntarily" departed. By way of comparison, a lower percentage of detainees (27 percent) left the country from the Howard County Detention Center because they were formally deported, or left under the so-called "voluntary departure" procedure.
Were Detained Individuals from the Local Area?
Information on the place of arrest was not included in the available data ICE released. However, we can examine whether the Howard County Detention Center was the first ICE facility in which these detainees were held. According to ICE records, for some (11 percent) of these detainees, the Howard County Detention Center was the first place they were sent when they were detained by ICE. The remaining 89 percent had been transferred in from another ICE detention facility.
We can also look at how quickly they arrived at this facility after they were first detained. A total of 76 percent arrived at the Howard County Detention Center at some point during the very first day they were detained by ICE. There was considerable variability among detainees in the number of detention facilities they had been held in before they were finally deported or released from this facility. The number of facilities ranged as high as 4 separate locations for some detainees. These figures again are based on an analysis of the most recent 12 months for which data are available.
For the United States as a whole, last year the average number of ICE facilities detainees moved through was 1.8. Detainees at the Howard County Detention Center on average had stayed at somewhat more (2.1) ICE facilities.
Reason Left ICE Facility Profile U.S Profile Number Percent Percent Bonded out 49 35.2 % 11.0 % Deported/Removed 26 18.7 % 55.3 % U.S. Marshal or Other Agency 19 13.6 % 4.5 % Orders of Recognizance or Supervision 18 12.9 % 19.8 % Proceedings Terminated 14 10.0 % 1.3 % Voluntary departure 11 7.9 % 0.9 % Prosecutorial Discretion 2 1.4 % 1.0 % Alternative ATD custody 0 . 0.1 % Died 0 . 0.0 % Escaped 0 . 0.0 % Release to ORR 0 . 0.1 % Paroled 0 . 5.2 % Withdrawal 0 . 0.2 % Total 139 100.0 % 100.0 %
Table 3: Reasons individuals left ICE detention during the last 12 months
Why Did Detainees Leave ICE Detention?
ICE records one of 29 reasons a detainee left ICE detention. As shown in Table 3, these reasons fall into 13 general categories -- from leaving because one is deported or removed, to leaving because one escaped or the individual died while in custody.
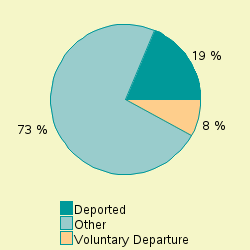
Deportation. As mentioned earlier, while nationally the most common reason that a detainee left ICE detention was that they were deported from this country, this was not the top reason at this facility. At the Howard County Detention Center only 26 individuals (19 percent) were deported or removed during the most recent 12 month period for which data are available. (ICE data did not distinguish between deportations and removals, and the terms are used interchangeably in this report.)
Bonded out. The most common reason a person left ICE detention from this facility was that they were released after posting a bond. A total of 49 individuals (35 percent) left the Howard County Detention Center because they were "bonded out." This generally covers situations where the individual posts a bond and is released while awaiting a decision on their deportation (removal) case. The amount of the bond is set by ICE, or by an Immigration Judge. Many individuals are not eligible to be released because their continued detention is considered mandatory under provisions in the immigration laws.
Transferred to criminal custody. A total of 19 individuals (14 percent) left this facility last year because they were turned over to U.S. Marshals or to some other government agency. This typically occurs because there is an outstanding criminal case against the individual, or the individual is needed as a material witness in a criminal case.
Orders. Orders are additional mechanisms that are sometimes used to release a person while their case is pending, or awaiting removal. Under an "order of recognizance" an individual is released with reporting conditions while in deportation proceedings and awaiting a final decision. A second type of order ("order of supervision") releases an individual after a final order of removal. Here an individual is released because ICE has not met the time limits the law imposes for deporting the individual. There were 18 (13 percent) who left the Howard County Detention Center detention for these reasons: one with an order of recognizance, and 17 with orders of supervision.
No legitimate grounds to deport. Sometimes individuals left ICE detention because they "won" their case. Typically this occurs when an Immigration Judge orders the deportation proceedings ICE has filed against them "terminated" (dismissed) and the judge's order after any appeals becomes final. Analysis of the latest 12 months of data show that a total of 14 individuals, or 10 percent were released from detention by the Howard County Detention Center because a determination was made that there were no grounds to deport the individuals and thus ICE had to release them from custody.
Voluntary departure. Under some circumstances, detainees are allowed to take "voluntary departures" or "voluntary returns." As with deportation, under voluntary departure a person must leave the country. However, unlike formal deportation where the individual is barred by law from reentering this country permanently or for a period of years, under voluntary departure and voluntary return the individual is not legally barred from reentry. An additional 11 detainees (8 percent) left the Howard County Detention Center last year as voluntary departures and voluntary returns.
Prosecutorial discretion. The Department of Homeland Security sets immigration enforcement priorities and guidance on the exercise of prosecutorial discretion (PD), including special programs on deferred action for childhood arrivals. To focus its limited resources on higher priority targets, individuals that don't fall into these high priority categories may -- through the exercise of prosecutorial discretion -- be released from custody and any proposed deportation actions deferred. A total of 2 individuals (1 percent) were released under these PD programs.
Escape and death. Nationally, there were 65 individuals who escaped ICE detention during the latest 12 month period for which data are available, and 6 individuals were recorded as having died in detention. No one was recorded by the Howard County Detention Center as either escaping or dying last year.
As shown in Table 3, no one was recorded as leaving the Howard County Detention Center during the past 12 months for the following reasons: Alternative ATD custody, Release to ORR, Paroled and Withdrawal. See "Reasons for Leaving ICE Detention" for a description of these categories.
Comparing Release Reasons Against The National Picture
In many respects release reasons for the Howard County Detention Center departed from the national picture. It was the case that a lower proportion left because they were deported from this facility (19 percent) than was true for the U.S. as a whole (55 percent). A higher proportion (8 percent) left this facility as voluntary departures than was true nationally (1 percent).
In addition, differences were seen for individuals released on bond (35 versus 11 percent), those released to the U.S. Marshal or other agency (14 versus 5 percent), detainees released on orders of recognizance or supervision (13 versus 20 percent), persons whose proceedings were terminated (10 versus 1 percent), and for those paroled (none versus 5 percent).
The facility's percentages fell within 3 percentage points of the national figures for all other categories.
Nationalities
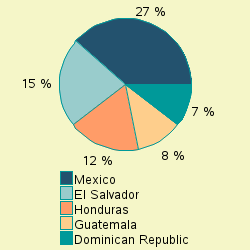
Which nationalities predominate? Last year in the United States, individuals from Mexico comprised the largest number of those leaving ICE detention. Some 43.4 percent of all detainees recorded Mexico as their country of origin. The Howard County Detention Center had a much smaller proportion of detainees from Mexico - 27 percent among their exits. Detainees from Mexico were also the largest single nationality group among those leaving detention from the facility.
In descending order, the other top nationalities after Mexico that made up those leaving ICE detention from the Howard County Detention Center last year were: El Salvador (15%), Honduras (12%), Guatemala (8%) and Dominican Republic (7%).
This compared to the United States as a whole where the other top five nationalities after Mexico were Guatemala (19%), El Salvador (15%), Honduras (12%) and Ecuador (1%).
For the frequency for each of the other nationalities among those leaving ICE detention from the Howard County Detention Center last year see Table 4.
Deportations and voluntary departures by nationality. Within the nationalities that made up those listed in Table 4 with more than one individual, the proportion deported or voluntarily departing varied from 0 percent to 54 percent. As mentioned above, this compares with 27 percent for all detainees.
Nationalities Ranked in Top 10 Left ICE Detention Total Deported/
Voluntary
DeparturePercent - ALL 139 37 26.6 % 1 Mexico 37 20 54.0 % 2 El Salvador 21 5 23.8 % 3 Honduras 17 1 5.8 % 4 Guatemala 11 4 36.3 % 5 Dominican Republic 10 0 0.0 % 6 Sierra Leone 5 0 0.0 % 7 Jamaica 4 0 0.0 % 8 Ecuador 3 0 0.0 % Nigeria 3 0 0.0 % Trinidad And Tobago 3 1 33.3 %
Table 4: Numbers leaving ICE detention by nationality
during the last 12 months
With the highest rate of 54 percent were detainees from Mexico where 37 individuals were deported or took voluntary departure. More than one country was tied with the lowest rate, where detainees were deported or took voluntary departure.